
SLIDE 1
Preparing for UNCTAD14
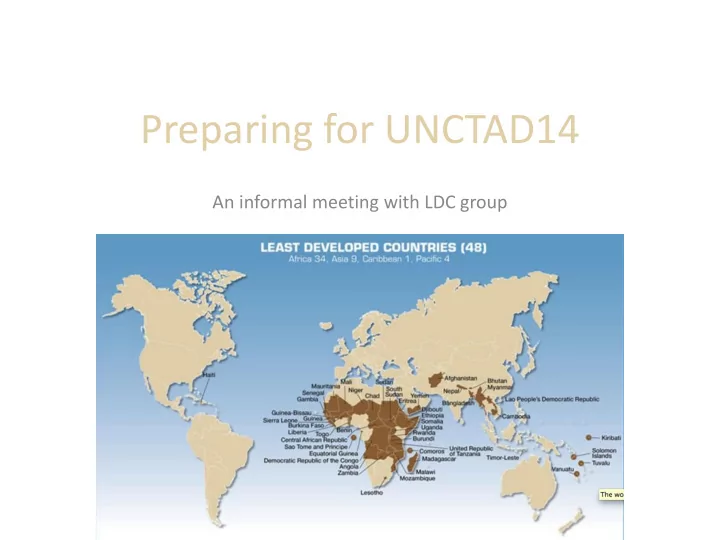
An informal meeting with LDC group
Preparing for UNCTAD14 An informal meeting with LDC group Agenda - - PowerPoint PPT Presentation
Preparing for UNCTAD14 An informal meeting with LDC group Agenda 14:30 - 14:45 Introduction 14:45 - 15:15 Services Waiver a GSPS? 15:15 - 15:30 NTM affecting LDCs 15:30 16: 15 Open discussion Which decisions ? ISTAMBUL PROGRAM OF ACTION
An informal meeting with LDC group
Significantly increase the share of least developed countries’ trade in global trade with the aim of doubling the share of least developed countries’ exports in global exports by 2020, including by broadening least developed countries’ export base
Accroître sensiblement la part des pays les moins avancés dans les échanges internationaux dans le but de multiplier par deux la part des exportations de ces pays dans les exportations mondiales d’ici à 2020, notamment en élargissant la gamme des produits d’exportation
1.15
0.00 0.50 1.00 1.50 2.00 2.50
2011 2020
Unctad stats
1.11 1.11 1.12 1.08 0.94 2.21 0.68 0.71 0.76 0.77 0.84 1.36 0.00 0.50 1.00 1.50 2.00 2.50 2011 2012 2013 2014 2015 2016 2017 2018 2019 2020
MERCHANDISE SERVICES
Unctad stats LDC´s Share of world trade
16.90 22.49 28.27
11.57 23.69 6.25 15.05 7.96 1.29
0.00 5.00 10.00 15.00 20.00 25.00 30.00 35.00
2006 2007 2008 2009 2010 2011 2012 2013 2014 2015
least developed countries world
Year to year change
20.86 21.16 12.58 15.86 0.00 5.00 10.00 15.00 20.00 25.00 2005 2006 2007 2008 2009 2010 2011 2012 2013 2014
world least developed countries
Market Access and National Treatment for 24 countries Extension to 2030 In CTS Evolution of Market Access Analysis of Supply capacity constraints Investment needs Services Policy Frameworks Technical Cooperation Aid for trade