
SLIDE 1
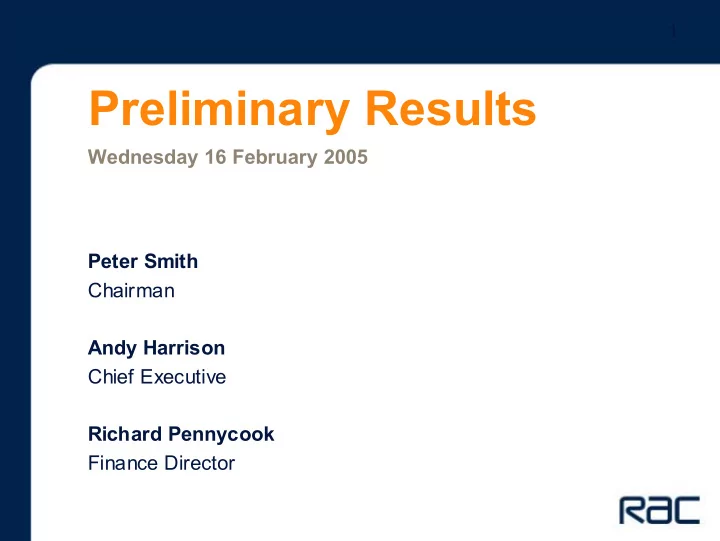
Preliminary Results
Wednesday 16 February 2005
1
Peter Smith Chairman Andy Harrison Chief Executive Richard Pennycook Finance Director
Preliminary Results Wednesday 16 February 2005 Peter Smith - - PowerPoint PPT Presentation
1 Preliminary Results Wednesday 16 February 2005 Peter Smith Chairman Andy Harrison Chief Executive Richard Pennycook Finance Director Preliminary results - agenda Highlights of the year Opportunities and issues Financial summary
Wednesday 16 February 2005
1
Peter Smith Chairman Andy Harrison Chief Executive Richard Pennycook Finance Director
2
3
Continuing revenues up by 8% Underlying profits up by 12% Profit before tax* up from £86.7m to £88.6m Debt reduced by £15m to £139.8m Dividend up 6.2% to 25.8p
*before goodwill amortisation and exceptionals
4
Total Roadside
Motoring Services
29%
Business Solutions
LVL
17%
Continuing growth in Roadside and Motoring Services Business Solutions
271%
LVL
16%
Financial Services; big opportunity Paccar; value maximised Disposals; MHS, Isuzu, Universal
5
6
Fleet Excellence awards –
and the Best in Driver Training - BSM Accident Management - RAC Business Solutions Vehicle Leasing - LVL Fleet Software - RAC Software Solutions Vehicle Recovery - Roadside
7
Colleague Satisfaction Survey 2002 2003 2004
8
Grow our membership base Expand Motoring Services
Grow in 5 target sectors:
– Motor manufacturers – Insurance – Airside – Defence – Utilities
9
Accelerating Roadside revenue growth
Financial performance
10
11
Membership growth of 4% pa 2000-2003 2004 dip in renewal rate, due to process issues Renewal rate now back to 82% - membership returned
1.9m 2.0m 2.1m 2.2m 2000 2001 2002 2003 2004 0% 10% 20% 30% 40% 50% 60% 70% 80% 90%
Units
File Size (m) Renewal %
12
New member acquisition up 9% on 2003 Market share maintained Roadside service at record levels
13
Renewal rate in December 2004 and January 2005
Membership returned to growth
2004 peak January 2005
14
0k 100k 200k 300k 400k 500k 600k 700k 800k 900k 2002 2003 2004 £50m £55m £60m £65m £70m £75m £80m £85m £90m £95m £100m Glass Jobs Sales
Good business in a mature market
– Generated £44m cash flow since acquisition – Delivered a 10% return on capital in 2004
Units
15
3 major insurance companies chose to single source Auto Windscreens was minor supplier and
Profits impacted by financial and operational gearing We are the leader in the fleet market
16
Won CIS business New insurance proposition
New working practices Process improvement
Expected to be stable
17
Major financial services opportunity Continuing growth and the potential deregulation
Continuing growth in Business Services
18
Financial Services is important
– AA £50m profit – Saga £60m profit
2004 RAC regained control: good progress
– Sales up 59% – Integration ahead of schedule and costs below budget – On track for 450k policies by end of integration phase – Organic growth in 2004 of 16% – Renewal rate of 80%, amongst industry best
19
Strong and trusted brand
– resonance in motoring financial services
A competitive proposition Small market share of 0.5% for motor insurance
20
Untapped membership file (2% have RAC insurance) Motor Insurance renewal dates will reduce cost of
Access to the young driver market
– 150,000 BSM pupils
Big motor claims handler Many motoring ‘touchpoints’ - breakdown, glass
21
Sales up 46% Legal Expense Insurance (LEI) policies sold up 14% Personal Injury (PI) cases handled up by 10%
22
LEI penetration of car insurance only 50%
Sell LEI directly to members Scope to grow our market share of PI market –
Margins very high; some pressure inevitable, especially
Proposed deregulation may allow RAC to handle
23
2005 will see a £5m increase in direct marketing to
Partly funded by cost reduction programme end 2004
24
£m 2003 2004 Target Market
Defence 74 71 200 Insurance 105 107 500 Vehicle manufacturers 79 103 300 Airside 13 17 50 Utilities 5 5 50 Total 276 303 1100
25
‘C’ vehicles
– expected signature end Q1 – full implementation end 2006
White label opportunities in Contract Hire Vehicle Solutions opportunities Continuing growth in LVL and RAC Business Solutions
26
Underlying profits continue to grow strongly Continuing sales growth in Consumer and
Roadside renewal rate improvement - membership
Auto Windscreens responding to action Big opportunities in Legal Services and
28
£m 2003 2004 %
Consumer Services 353.1 374.8 6 Business Solutions 160.8 169.8 6 LVL 207.2 241.8 17 Manufacturer Support Services 677.1 720.2 6 Other 3.3 2.5
Total – continuing operations 1,401.5 1,509.1 8
29
£m
2003 2004 % Consumer Services 51.3 47.5
Business Solutions 1.4 5.2 271 LVL 19.6 22.7 16 Manufacturer Support Services 32.0 26.8
Other
Total continuing operations 98.6 97.5
Discontinued operations
96.1 97.5 1 Interest
PBET 86.7 88.6 2
30
£m
2003 2004 % Reported PBET 86.7 88.6 2 Leyland contribution
End of DAF contract
2.5
63.6 71.2 12
31
32
£m
2003 2004 Reported PBET After charging: 51.3 47.5
33
£m
2003 2004 % RAC Business Solutions 1.4 5.2 271 Lex Vehicle Leasing 19.6 22.7 16 Manufacturer Support Services 32.0 26.8
Business Services - trading profit * 53.0 54.7 3
Business Services - underlying profit 27.4 37.3 36
* continuing operations
34
£m
35
£m 2003 2004
36
£m 2003 2004 Operating profit before goodwill 38.9 73.3 Interest paid
Tax paid
Working capital
5.2 Capital expenditure - net 36.3 5.4 Dividends from jvs and associates 15.2 18.5 LVL - Ford funding
Operational cash flow 61.8 62.4
37
£m
2003 2004 Operational cash flow 61.8 62.4 Disposals/ (acquisitions) 90.0
Dividends paid
Purchase of ESOS shares
Other movements 3.0 3.3 Net reduction in debt 127.9 14.5 Closing debt 154.3 139.8 Average debt in period 211.0 145.9
38
£m 2002 2003 2004
Lex Auto Logistics PBIT 24.5 23.5 15.5 Of which: DAF contribution 7.1 3.8
10.7 10.0 7.4 Additional Leyland margin 8.4 11.8 10.0 Pro forma LAL ex Paccar
39
RAC maintains an open defined benefit scheme Actions were taken in 2003 to address the deficit, with
Approximately half the company contribution (c£11m)
Actuarial valuation in 2004 resulted in an unchanged
Further review will take place when actuarial profession
40
Affecting RAC and UK plcs
– Share options (IFRS 2) - executive and SAYE – Pensions (IAS 19) – Financial instruments (IAS 39)
Affecting LVL, Transfleet and Legal
– Leases (IAS 17)
profit recognition towards end of contract reduces short term earnings (timing difference only) reduces RV impact
– Revenue recognition (IAS 18)
Claims handling revenues advanced
– Profit impact broadly neutral
41
Strong underlying profit growth
– Up 12% pa over last 3 years
Expect continuing growth in Consumer
Roadside renewal rate is improving
Auto Windscreens is responding Big Financial Services opportunity Cashflow remains strong
43
Continuing revenue growth Leading edge technology underpins service awards Best ever service levels
– Customer satisfaction 86.9% (2003: 86.5%) 2003 2004 %
44
Sales growth: 10% Record number of instructors: 3,039 - (2,817) Record number of pupil starts: 157k - (145k)
45
Strong sales growth continues - up 46% 21.4k PI claims handled - up 10% In-house legal team increased by 55% to 45 2.4m legal expense policies sold - up 14%
46
* Source: Datamonitor Personal Injury Report 2004
2002
2003
2004
Actual RTA Claims
Potential RTA Claims
5 10 15 20 25 2002 2003 2004
47
Total sales grow by 59% Like for like sales grow by 16% Total policy base reaches 276k - up 4% Industry leading renewal rates achieved AXA Direct transaction on track - but early days
48
£m 2003 2004 %
– driver license verification – customer management centre (Kia) – centralise booking service (Vauxhall & Daimler Chrysler Fleet Services) – growth in France
accident management launched
49
Strong growth in core fleet (8%) Ford integration successfully completed - other white
Residual values more favourable than projected
£m 2003 2004 %
*RAC share
50
£0m £5m £10m £15m 1994 1995 1996 1997 1998 1999 2000 2001 2002 2003 2004 H1
51
0% 5% 10% 15% 1997 1998 1999 2000 2001 2002 2003 2004 H1 H2
52
£m 2003 2004 %
53
£m 2003 2004 Fleet assets 10
501 534 Other fixed assets/investments 222 234 Working capital/other
Capital employed 553 568 Net debt
Shareholders’ funds 399 428
Closing net debt is after offsetting £36m of ring fenced cash and investments
54
2003 2004 Interest cover 10.2 11.0 Net debt/EBITDA 1.3 1.2 Underlying tax rate 28% 28% EPS (p) (pre exceptionals) 54.4 55.7 Dividend per share (p) 24.3 25.8 Dividend cover 2.2 2.2
55
£m 2003 2004 Mechanical Handling Additions
Disposals 5.1 1.8 Depreciation 52.3 3.4 (Profit) / loss on disposal
37.7 3.4 BSM Additions
Disposals 30.7 34.9 Depreciation 0.7 0.4 (Profit) / loss on disposal 0.1 0.1 Net capital expenditure
56
£m 2003 2004 Rest of Group Additions
Disposals 12.6 8.7 Depreciation 24.2 28.4 (Profit) / loss on disposal 0.8
Net capital expenditure 0.2 5.8 Total Additions
Disposals 48.4 45.4 Depreciation 77.2 32.2 (Profit) / loss on disposal 0.4
Net capital expenditure 36.3 5.4
57
£m Industrial Solutions Manufacturer Support Services Discontinued Operations Turnover Reported 2003 117.0 627.9 56.9 Transfleet
78.3
Multipart Universal
8.8 Isuzu
20.3 Reported 2004
124.7 Profit & Loss Reported 2003
31.2
Transfleet
0.7
2.1
Multipart Universal
Isuzu
0.2 Reported 2004
58
£0m £50m £100m £150m £200m £250m £300m £350m 12/01 12/02 12/03 12/04
146 211 295 Total 131 133 162 NCH 15 78 133 CH FY 2004 FY 2003 FY 2002 £m Average debt
334 282 154 140
59
849 922 1,407 1,275 357 404 410 535 685 767 789 713 842 739 610 518 250 250 £0m £500m £1,000m £1,500m £2,000m £2,500m £3,000m £3,500m £2,733m £2,832m £3,466m £3,291m C Vehicles Inventory Mngt RAC Subs RAC Bus Sols Contract Hire FY2001 FY2002 FY2003* FY 2004*
* Includes C Vehicles - currently preferred bidder
60
£m
61
£m MSS LVL Cons’er Bus Solu’ns Total Defence 50 18 2 1 71 Insurance 8 9 90 107 Vehicle Manufacturers 24 27 52 103 Airside 17 17 Utilities 2 3 5 Total 101 48 11 143 303