
SLIDE 1
Preliminary Results May 2017 Disclaimer This presentation - - PowerPoint PPT Presentation
Preliminary Results May 2017 Disclaimer This presentation (hereinafter "this document") has been prepared by Hibernia REIT plc (the "Company or Group) for information purposes only. This document has been prepared in good
2 This presentation (hereinafter "this document") has been prepared by Hibernia REIT plc (the "Company“ or “Group”) for information purposes only. This document has been prepared in good faith but the information contained in it has not been independently verified and does not purport to be comprehensive. This document is neither a prospectus nor an offer nor an invitation to apply for securities. No representation or warranty, express or implied, is given by or on behalf of the Company, its group companies, or any of their respective shareholders, directors, officers, employees, advisers, agents or any other persons as to the accuracy, completeness, fairness or sufficiency of the information, projections, forecasts or opinions contained in this presentation. In particular, the market data in this document has been sourced from third parties. Save in the case of fraud, no liability is accepted for any errors,
Certain information contained herein may constitute “forward-looking statements” which can be identified by the use of terms such as “may”, “will”, “should”, “expect”, “anticipate”, “project”, “estimate”, “intend”, “continue”, “target” or “believe” (or negatives thereof) or other variations thereon or comparable terminology. Due to various risks and uncertainties, actual events or results or actual performance of the Company may differ materially from those reflected or contemplated in such forward-looking
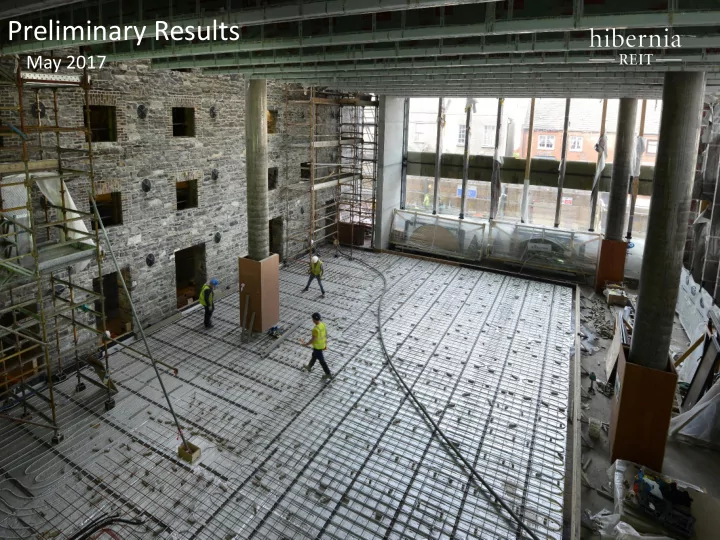
Pictured on cover: 1WML Reception/Town Hall
3
Market update Acquisitions and developments Portfolio management Conclusion and outlook
Financial results
4
– Portfolio value of €1.2bn, up 9.9% in the year(1) (developments up 47.2%(1)) and 7.4% in H2(1) – 12 month total property return of 14.5% vs IPD Ireland Index up 11.2% – EPRA NAV per share of 146.3c, up 11.9% in year – EPRA earnings up 192.5%(2) to €15.0m, dividend for year of 2.2c up 46.7%
– Three schemes completed, delivering 191k sq. ft. and profit on cost of 50% – Four committed schemes delivering 354k sq. ft. of offices over period to late 2018 – Pipeline expanded to 5 schemes (660k sq. ft.) with acquisition of Clanwilliam Court
– 320k sq. ft. of new office lettings/lease extensions in the year – Contracted rent roll now €48.3m, +24% in the year – WAULT to break of in-place offices now 6.7yrs, +56% in the year
– Building management department formed – Flexible workspace arrangement with Iconic Offices established
– Net debt €155.3m, LTV 13.3% (March 2016 5.7%) – Cash & undrawn facilities €288.9m, €149.5m net of committed capex and anticipated repayment of 1WML facility
(1) Net of capex and acquisition costs (2)
In-place office portfolio 915k sq. ft. Committed developments (pre-let) 73k sq. ft. Committed developments (to let) 280k sq. ft. Near term pipeline 50k sq. ft. Longer term pipeline 336k sq. ft.
5
Office IFSC 22% Office South Docks 15% Office Traditional Core 38% CBD Office Development 14% Industrial 1% Residential 10%
Total: €1.2bn Total: 1.7m sq. ft.(1)
Portfolio key statistics Number of properties Portfolio rent(4) In-place office rent and ERV(4) In-place
In-place
28 properties Passing: €42.2m Contracted: €48.3m Contracted: €40psf ERV: €48psf(5) To review/expiry: 3.5yrs To break/expiry: 6.7yrs 3%
(2) (3)
Portfolio by sector (by value) Office and development portfolio (by net lettable area)
(1) Office areas only (i.e. excl. retail, basement space, gym, townhall etc.) (2) Cumberland Place (Phase 2) (3)
development potential at Gateway for c.130k sq. ft. of offices (4)
(5) ERV as per CBRE @ Mar 17. Note: CBRE assume c.€18.2m capex to achieve this ERV
6 Increase rental income and duration Deploy capital into selective acquisitions or new developments Recycle capital to monetise gains and enhance forward returns Deliver improvements in environmental efficiency
Maintain an efficient balance sheet (target LTV 20%-30%) Delivery of development projects and preparation
developments
Good progress made in the year with more to come
7
– 354k sq. ft. of offices being delivered through four schemes in next 18 months
– Acquired in-place portfolio is 24% reversionary and has 3.2 years to rent review/expiry
– Pipeline of five further developments with potential to add up to 386k sq. ft. of net new office space – 56% of pipeline already planning approved
– Growth expectations raised – Expect Brexit movers will start to make decisions on destinations in H2
– Talented team – Clear strategy – €149.5m of cash and undrawn facilities(2)
Hibernia well positioned
(1) 59k sq. ft. offices, 12k sq. ft. gym (2) net of committed developments and anticipated repayment of 1WML facility
8
Market update Acquisitions and developments Portfolio management Conclusion and outlook Highlights
9
31-Mar-17 31-Mar-16 % change Portfolio value 1,167,387 927,656 26% Net debt 155,257 52,918 193% Loan to value 13.3% 5.7% 133% Net assets 1,013,852 896,574 13% EPRA NAV per share (cent) 146.3c 130.8c 12%
(€’000)
Substantial uplift in recurring distributable income due to letting activity
12 months to 31-Mar-17 12 months to 31-Mar-16 % change Net rental income (1) 39,681 25,389 56% Revaluation gain 103,525 125,056
Net profit 118,586 136,797
EPRA earnings (1) 14,989 5,124 193% EPRA EPS(1) 2.2c 0.8c 193% Dividend per share 2.2c 1.5c 47%
(€’000)
new lettings
uplift in net rental income and EPRA earnings
96.4c 111.8c 130.8c 146.3c 90c 100c 110c 120c 130c 140c 150c Mar-14 Mar-15 Mar-16 Mar-17 EPRA NAV per share (cent) +52%
(2)
(1) 12 months to Mar-16 figures excl. receipt of €4.9m (FBD surrender) (2) Including capex & acquisitions
Highlights EPRA NAV per share progression Income statement Balance sheet
130.8 146.3 2.2 125 130 135 140 145 150 Mar-16 Investment properties reval. Development properties reval. EPRA EPS Dividends paid Mar-17 EPRA NAV cent per share +12% 5.8c 9.1c
Traditional Core IFSC South Docks Other 1WML 1SJRQ
Valuation uplift: 14.9c
Cumberland(1)
(1.6) Like-for-like in-place office valuation(2): +2.8% All via ERV growth; negligible yield impact
Cumberland (Phase 2)
10
(1) Cumberland Phase 1 (completed refurbishment in Sep 16) and Phase 2 (potential additional 50k sq. ft. on front site) both included in development properties for the period. From 30 Sep 16, Phase 1 is classified as investment property and Phase 2 remains as development property (2) Represents c.€440m of properties excl. Harcourt Square, 1DC, 2DC & Clanwilliam Court
Strong uplift in EPRA NAV per share since 31 Mar 16
11
Acquisitions in current year €2,380 Acquisitions in prior year €7,160 Lease renewals €900 Lease expiries & other (€720) €10,024 (€4,900 ) €5,920 €9,720 (€1,574 ) (€290 ) €0 €5,000 €10,000 €15,000 €20,000 €25,000 Mar-16 Surrender premium New lettings
schemes Lease events/ acquisitions Admin costs Finance costs (net) Other Mar-17 EPRA earnings ‘000
+50%
(€3,911)
+193%
(1)
€14,989
(1) Net of income received i.e. Starwood promote fee (in ‘Other Gains & Losses’), which was net neutral for Hibernia
Significant uplift in EPRA earnings since 31 Mar 16 (€’000)
Acquisitions in current year €2,380 Acquisitions in prior year €7,160 Lease renewals €900 Lease expiries & other (€720) Performance fee €163 Other admin (€4,074)
Net cash invested €813m IPO €372m Committed capex €95m P+OO €286m RCF €400m Remaining inv. capacity
€150m DB 1WML Debt €44m €44m €0m €200m €400m €600m €800m €1000m €1200m Uses of funds Sources of funds
12
Current LTV of 13.3%: if RCF fully invested, LTV would be 28%(3)
Hedged €100m(1) Hedged €44m(2)
(1) €100m hedged from Nov 16 to Nov 20. Hedging instruments are a combination of interest rate caps and swaptions with strike rates of 1% (reference rate is 3M Euribor) (2) Facility fully hedged per expected drawing schedule using interest rate caps with a 1% strike rate (reference rate is 3M Euribor) (3)
€34m €19m €14m €31m €13m €16m €6m €1m €10m 13% 18% 20% 0% 5% 10% 15% 20% 25% €0m €10m €20m €30m €40m €50m €60m €70m €80m To Y/E March 2017 (A) Y/E March 2018 (F) Y/E March 2019 (F) Expected LTV (%) €m of capital expenditure 1WML 1SJRQ Hanover Building Two Dockland Central LTV (RHS)
13
Project
capex €m Spent at Mar-17 €m Left to spend €m 1WML €53m €34m €19m 1SJRQ €58m €14m €44m Two Dockland Central €11m €1m €10m Hanover Building €22m
Total committed €144m €49m €95m Maintenance capex €1m
(3) (2) (2)
(1) LTV based on valuers’ estimates of GDV at Mar-17 (2) Hibernia est. all in cost of 1WML on 100% basis is €77m (i.e. €24m all-in land cost (see slide 15) plus €53m total capex). Hibernia’s financial accounts show that the cost of acquiring 100% of 1WML was €36m which incl. the vendor’s 50% share of capex spent to date of acquisition of €13m. There was c.€28m of capex remaining (based on est. total capex of €53m) to be spent at date of acquisition. Therefore, the total cost of the project is €77m (€36m + €28m + €13m = €77m) (3) €9.4m net of dilapidations received
Forecast capital expenditure by financial year – committed developments
€1.1m €0.4m €6.9m €2.9m €2.1m €2.1m €6.4m €5.2m €1.2m €2.9m €1.4m
€15m €25m €35m €45m €55m €65m €75m Contracted in-place rent roll at 31 Mar 17 Let To let Proforma
€64.0m +€19.9m +45% €72m +€27.9m +63%
14
Average office ERVs of ‘To Let’ space as per CBRE Mar 17:
€53.25psf (ground floor and above only)
€50.70psf (excl. townhall)
€52.35psf
€47.45psf
Substantial increase in rent roll expected as developments are let and from asset management
In-place office reversion(1,3)
Potential incremental rent roll
Vacant space(3)
1WML Vacant(2) space 2DC 1SJRQ Incremental Harcourt Square Cumberland 1DC €44.1m Completed developments SOBO 2DC 1WML Total contracted rent: €48.3m(1) Hanover
Total potential rent roll(3)
Committed
(1)
(2)
(3) At valuers’ ERV 31 Mar 17/ Valuers’ ERV assumes capex of €18.2m
Based on CBRE estimated rental values, Mar 17
15
Scheme Area post completion (sq. ft.) Purchase price (incl. costs) (€m)
capex (€m) Capex to spend at Mar-17 (€m) ERV(2) €m Office(3) (To Let) €psf 1WML Office: 122k Retail/Reception: 13k €24m(4) €53m(4) €19m €7.3m(5) €50.70 1SJRQ Office: 115k Retail/Café/Amenity: 6k €18m €58m €44m €6.4m €53.25 2DC Office: 73k(6) €46m €11m(7) €10m €4.1m(6) €52.35 Hanover Building Office: 59k Gym: 12k €21m €22m(8) €22m(8) €3.0m(8) €47.45(8) Total Office: 369k(6) Other: 31k €109m €144m €95m €20.8m Sensitivity of development profits to come from committed schemes (excl. Hanover)(9) Yield 5.75% 5.50% 5.30% 5.00% 4.75% 4.50%
€47.50psf (€12m) (€4m) €3m €14m €25m €37m €50.00psf (€3m) €6m €13m €25m €37m €49m €52.17psf €4m €13m €20m €33m €45m €58m €55.00psf €14m €23m €31m €44m €57m €71m €57.50psf €22m €32m €41m €55m €67m €82m €60.00psf €31m €41m €50m €65m €78m €93m €62.50psf €41m €51m €61m €76m €90m €104m Profit left to come based on valuers’ current yields/ERVs
(1) Assuming valuers’ estimate of GDV at Mar-17 (2) Per valuers’ ERV at Mar-17 average (3) Office areas ground floor and above only (4) Refer to footnote (2) on slide 13 (5)
(6) 57k sq. ft. of entire 2DC (73k sq. ft.) is refurbished space. ERV for refurbished space only is €3.2m (7) €9.4m net of dilaps (8) Valuers’ ERV is based on assumption of capex budget of €13.8m vs. Hibernia expectation of €22m (9) At 31 March 2017 CBRE, the independent valuer, had an average estimated rental value for the unlet office space (221,000 sq. ft.) in our three committed schemes at that point (1WML, 1SJRQ, Two Dockland Central) of €52.17psf and were assuming an average yield of 5.30% upon completion: based on these assumptions they expect a further c. €20m
schemes.
16
– EPRA NAV +12% to 146.3c – Lettings increasing NRI (+56%(1) to €39.7m) and contracted rent
– Absolute: NAV per share growth >10% €2.6m fee – Relative: TPR of 14.5% vs IPD Ireland 11.2% €3.3m fee
– 1.45c final dividend proposed, 2.2c for the year
– Small cost impact in year – In future intended to be net cost neutral but expect gross up revenue by €5m-€6m: no material impact on net rental income
– Current LTV of 13.3% – Cash and undrawn facilities of €289m: €150m including committed capex and anticipated repayment of DB facility
(1)
17
Acquisitions and developments Portfolio management Conclusion and outlook Highlights Financial results
4% 6% 8% 10% 12% 14% 16% 1.8m 1.9m 2.0m 2.1m 2.2m 2007 2008 2009 2010 2011 2012 2013 2014 2015 2016 2017(f) 2018(F) 2019(f) 2020(f) Numbers in employment (LHS) Unemployment rate (RHS) 2014 2015 2016 2017F 2018F Consumption 1.7% 4.5% 3.0% 2.6% 2.7% Government 5.4% 1.1% 5.3% 2.5% 2.0% Investment 18.2% 32.7% 45.5%
5.8% Core investment* 14.4% 14.7% 2.3% 9.3% 9.9% Domestic Demand 6.2% 11.2% 16.4%
3.6% Core Domestic Demand* 4.2% 5.4% 3.2%** 3.7% 3.7% GDP 8.5% 26.3% 5.2% 4.1% 3.3%
2 4 6 8 45 50 55 60 65 70 Oct-13 Dec-13 Feb-14 Apr-14 Jun-14 Aug-14 Oct-14 Dec-14 Feb-15 Apr-15 Jun-15 Aug-15 Oct-15 Dec-15 Feb-16 Apr-16 Jun-16 Aug-16 Oct-16 Dec-16 Feb-17 Manufacturing PMI Services PMI Construction PMI No change
18
50 = no change on previous month Brexit vote, Jun-16 2007 peak employment = 2.2m 2012 peak unemployment = 15.2%
Dublin Rest of country Employment* (since 2010) +11% +7% New FDI Jobs** (NET, since 2010) +29k +25k Office employment* (since 2010) +10% +4% Employed in same region as residence* 97% 83% Population under 40yrs old* 52% 46%
Source: CSO/EY/Oxford Economics/European Commission *Source: CSO/Hibernia **Source: IDA Ireland
PMIs recovering after initial softening post UK referendum… …with healthy core domestic demand growth forecast Strong Irish employment fundamentals expected to remain… …and Dublin continues to outperform
Source: Bloomberg/Markit Source: CSO, Goodbody *excl. R&D and aircraft leasing **estimate due to suppressed data on R&D and aircraft leasing by CSO in Q4 2016
< 5k sq. ft. 13% 5k - 10k sq. ft. 17% 10k - 20k sq. ft. 17% 20k - 50k sq. ft. 25% 50k - 100k sq. ft. 16% >100k sq. ft. 12% 0% 2% 4% 6% 8% 10% 12% 14% Dublin 1/3/7 Dublin 2/4 Dublin 6/8 IFSC City Centre South Suburbs North Suburbs West Suburbs Overall vacancy rate Grade A vacancy rate Other 22% Professional services 15% TMT 21% Financial services 14% Public sector 3% Undisclosed 25% 0.0 0.5 1.0 1.5 2.0 2.5 3.0 1995 1996 1997 1998 1999 2000 2001 2002 2003 2004 2005 2006 2007 2008 2009 2010 2011 2012 2013 2014 2015 2016 Q1 2017 Millions Sq Ft Annual Dublin office take up 10 Year Average
19
Prime Grade A rents now €62.50psf on back of broad-based demand
Active demand @ Sep 16: 2.7m sq. ft.
Other 21% Professional services 14% TMT 24% Financial services 13% Public sector 4% Undisclosed 24%
Active demand @ Mar 17: 3.8m sq. ft.
Overall Dublin vacancy rate now 7.0% with the grade A vacancy rate at 3.1% in D2/4 (core CBD location) 47% of take-up* is for space less than 20k sq. ft. Dublin office take-up of 2.6m sq. ft. in 2016 Occupier active demand remains broad based
Source: CBRE @ 31 Mar 17 Source: CBRE @ 31 Mar 17 *total gross take-up over the period Q1 2011 to Q1 2017 Source: CBRE @ 31 Mar 17 Source: Cushman & Wakefield/Hibernia
0.2m 1.1m 2.1m 1.5m 1.8m 1.8m 0.0m 0.5m 1.0m 1.5m 2.0m 2.5m 3.0m 3.5m 2015 (A) 2016 (A) 2017 (F) 2018 (F) 2019 (F) 2020 (F) Potential sq. ft. Expected year of completion
20
Funding constraints likely to limit speculative development
CBRE 10yr avg. CBD take-up = 1.3m sq. ft. CBRE 2016 take-up = 2.6m sq. ft. CBRE 10yr avg. take-up = 1.9m sq. ft.
Pre-let/let Under construction Completed Probability weighted pipeline
Source: CBRE/Hibernia (1) non-probability weighted
50% of anticipated supply in 2017 is pre-let, expecting lower completion in 2018 - 2020
4.65% 2% 3% 4% 5% 6% 7%
21
Investment volumes expected to return towards long term trend
€0.0bn €1.0bn €2.0bn €3.0bn €4.0bn €5.0bn 2006 2007 2008 2009 2010 2011 2012 2013 2014 2015 2016 Q1 2017 Office Retail Mixed use Industrial Residential Other Recent active funds
0% 5% 10% 15% Q1 1995 Q1 1996 Q1 1997 Q1 1998 Q1 1999 Q1 2000 Q1 2001 Q1 2002 Q1 2003 Q1 2004 Q1 2005 Q1 2006 Q1 2007 Q1 2008 Q1 2009 Q1 2010 Q1 2011 Q1 2012 Q1 2013 Q1 2014 Q1 2015 Q1 2016 Q1 2017 Prime Dublin office yields Ireland 10yr Government bond yield German 10yr Government bond yield
360bps
government bonds remains very wide
real estate – expect investment volumes to normalise
context
Real estate yields attractive relative to bonds Investment volumes likely to move back towards long term trend Dublin prime office yields in a European context Highlights
Source: CBRE @ Mar 17 Source: CBRE/Bloomberg LP @ Mar 17 Source: CBRE @ Mar 17
22
Market update Portfolio management Conclusion and outlook Highlights Financial results
Sector Total NIA post completion (sq. ft.) Full purchase price Capex/Est. capex
(incl. land) €psf ERV(1) Office ERV psf(1) Expected PC Date Completed schemes in 12 months to 31 Mar 17 One Dockland Central Office 74k(2) €46m €10m(3) €736psf(4) €4.0m €50.40psf Completed in May 2016 SOBO Works Office 11k €2m €1.3m €275psf €0.4m €37.10psf Completed in April 2016 1 Cumberland Place Office 122k(5) €51m €31m €668psf(6) €6.9m €51.05psf(7) Completed in Sept 2016 Total completed 207k €99m €42.3m(8) €11.3m Committed schemes Two Dockland Central Office 73k(9) office €46m €11m(10) €765psf(4) €4.1m €52.10psf Q3 2017 1WML Office 122k office 7k retail 6k reception 14 resi. units €24m(11) €53m(11) €557psf(7) €7.3m(12) €51.95psf(7) mid 2017 Hanover Building Office 59k office 12k gym €21m €22m(13) €680psf(7) €3.0m(13) €47.40psf(13) late 2018 1SJRQ Office 115k office 5k retail 1k amenity €18m €58m €639psf(7) €6.4m €53.25psf mid 2018 Total committed 369k office 24k retail/gym 14 units 7k other €109m €144m(14) €20.8m
CONCEPT IMAGE
23
CONCEPT IMAGE
(1) Per CBRE valuation at 31 Mar 17 (2) 58k sq. ft. refurbished out of total 74k sq. ft. (3) €7.9m net of dilapidation charge received (4)
(5)
potential new block (c.50k sq. ft.) but incl. rentalised reception (2k sq. ft.) (6) No cost attributed to basement area (7) Office demise only (8) €40.2m net of dilapidation charge received (9) 57k sq. ft. is committed refurbishment of entire 73k sq. ft. (10) €9.4m net of dilapidations charge received (11) Refer to footnote (2) on slide 13 for workings (12) Commercial (incl. reception/townhall) and residential (13) CBRE valuation assumes capex of €13.8m vs. Company planned capex of €22m. CBRE office ERV of €47.40psf based on €13.8m capex (14) €142.4m net of dilapidations charge received
24
2016 for €33m
rent of €2.1m (€57.60psf)
approach with surrounding four Hibernia properties
25
mid-2018 completion
− Estimated cost of €11m (€9.4m net of dilaps(1)) − Expected completion late 2017
− HubSpot to occupy 32k sq. ft. (2nd and 3rd floors) on two separate 19yr leases (break at 10.5yr) at a rent of €52.50psf (€1.8m p.a.) − ENI to occupy 6k sq. ft. (4th floor) on a 20yr lease (break at 12yr) at a rent of €55psf (€0.3m p.a.) 26
(1) Dilaps received in FY 2016
Hibernia campus
27
Sector Current NIA (sq. ft.) NIA post completion (sq. ft.) Full purchase price Comments Near term Cumberland Place (front block) Office 0k c.50k €0m(1)
Total near term 0k c.50k €0m Longer term One Earlsfort Terrace Office 22k >28k €20m
which would add c.6k sq. ft. to the NIA
Earlsfort Centre scheme Harcourt Square Office 117k on 1.9 acres 277k €72m
and ancillary space
Blks 1, 2 & 5 Clanwilliam Court and Marine House Office 135k c.190k €80m
NIA across all 4 blocks Gateway Logistics/Office 14.1 acres(2) c.115koffice(3) €10m
planning Total longer term 274k 610k €182m
28
CONCEPT IMAGE
(1) €51m (incl. costs) paid for existing block which was refurbished and completed in Sep 16. No land value attributed to new block at acquisition (2) Currently 178k sq. ft. of industrial/logistics (3) Planned new offices of c.115k sq. ft. plus potential to add a further c.130k sq. ft. of offices
existing building
de-risked
29
30
Market update Acquisitions and developments Conclusion and outlook Highlights Financial results
% of portfolio Initial Equivalent Reversionary Passing Rent (€m)
Traditional Core €439m 38% 6.9% 6.8% 29.6% 4.1% 5.3% 5.7% €20.3m IFSC €254m 22% 5.7% 5.7% 36.7% 3.7% 5.1% 5.3% €9.9m South Docks €177m 15% 3.1% 3.1% 31.7% 2.9% 5.3% 5.7% €6.1m Total Dublin CBD Offices €870m 75% 5.7% 5.7% 32.0% 3.7% 5.3% 5.6% €36.3m
Development €168m 14% 45.8% 47.2% 86.7%
€116m 10% 2.6% 2.6% 23.7% 4.3% 4.6% 4.6% €5.2m
€13m 1% 6.1% 6.1% 26.0% 6.2% 6.5% 6.8% €0.7m Total Investment Properties (incl. offices) €1,167m 100% 8.5% 9.9% 36.8% 3.8% 5.2% 5.5% €42.2m Value as at Mar 17 (all assets) % uplift since Mar 16
acquisition (1) % uplift since Mar 16
acquisition(1) Yield on Value % % uplift since acquisition
acquisition (1)
31
Equivalent yields remain broadly stable
(5.6) (5) (2) (4) (5) (5) (5) (5) (5,6) (5,6) (3)
(1) Includes capex in acquisition costs (2) Includes full value of 2DC in IFSC (even though under refurbishment) (3) Excludes the value of space occupied by Hibernia in South Dock House. Incl. full value of Hanover Building (4) 1 Cumberland Place in Traditional Core but value of site (Phase 2) in Dublin CBD Office Development (5) Harcourt Square yield is the yield on the existing building (91% of property value) (6)
(5)
TMT 32% Government Agency 27% Banking & Capital Markets 24% Professional Services 11% Other 4% Insurance & Reinsurance 2% 17% 13% 8% 6% 5% 4% 4% 4% 3% 3% 33% Remainder
€38.0m €38.0m 32
In-place office portfolio statistics Contracted rent Mar-15 Mar-16 Mar-17 €22.2m +23% €27.3m +39% €38.0m Industry split of in-place tenants Top 10 tenants of in-place portfolio (by contracted rent)
33 In-place office portfolio statistics
Contracted rent (€m/€psf) ERV (€m/€psf) WAULT to review(1) (yrs) WAULT to break/expiry (yrs) % of rent upwards
% of next rent review cap & collar % of rent MTM(3) at next lease event Acquired in-place office portfolio €27.8m(€37psf) €34.6m(€47psf) 3.2yrs 5.2yrs 38% 0% 62% Completed office developments(4) €10.2m(€49psf) €10.4m(€50psf) 4.4yrs 10.7yrs 0% 83% 17% Whole in-place office portfolio €38.0m(€40psf) €45.0m(€48psf)(5) 3.5yrs 6.7yrs 28% 22% 50% Pre-let committed schemes(6) €4.1m(€54psf) €4.1m(€54psf) 5.3yrs 11.6yrs 0% 8% 92% Whole office portfolio €42.1m(€41psf) €49.1m(€48psf) 3.7yrs 7.2yrs 25% 21% 54%
Lettings (esp. developments) significantly extending WAULTs
(1) To earlier of review or expiry (2)
(3) Mark to Market (4) Cumberland, SOBO, 1DC (5) CBRE assume c.€18.2m capex to achieve this ERV (6) 2DC, 1WML
34 Office leases agreed since Mar 16
Type Tenant Building Contracted rent €m Contracted rent €psf % of Group rent Term Notes To expiry To break Pre-let 1WML €2.1m €55.00psf 4% 17yrs 12yrs
Pre-let Two Dockland Central €1.8m €52.50psf 4% 19yrs 11yrs
Pre-let Two Dockland Central €0.3m €55.00psf <1% 20yrs 12yrs
2017 Letting Cumberland House €1.8m €53.85psf 4% 25yrs 11yrs
Letting One Dockland Central €1.6m €50.00psf 3% 20yrs 11yrs
Letting Central Quay €0.6m €52.50psf 1% 10yrs 3yrs
Letting SOBO Works €0.4m €35.70psf(1) <1% 13yrs(2) 6yrs
Letting The Chancery €0.2m €37.20psf(3) <1% 15yrs 7yrs
Letting Harcourt Square €1.1m(4) €46.70psf 2% 6yrs 6yrs
Rent Review Observatory €0.5m(4) €48.50psf 1% 10yrs 10yrs
Term extended by 5yrs to 2027 and break
Arrangement Clanwilliam Court (Block 1) N/A N/A N/A
Total €10.4m 22%
(1) Average: stepped rent for 4yrs (2) Weighted average. Main office lease is for 15yrs (3)
(4) Incremental rent
35
€45psf
above this
insight into a fast growing area
Pictured: Iconic Offices at ‘The Brickhouse’, Clanwilliam Court (Block 1)
36
Market update Acquisitions and developments Portfolio management Highlights Financial results
37
Strong performance in the year and plenty still to come from development programme
Positive economic backdrop in Ireland
Brexit decisions on destinations likely in H2
Hibernia well positioned with clear strategy, talented team and low leverage Creating value through active management
38
39
40
Key: Office Residential Industrial Office development
Croke Park Fairview Park River Liffey Kings Inns St. Stephens Green 9 8 7 6 2 12 13 14 4 5 11 10 15
1 Wyckham Point 2 New Century House 3 Gateway Site 4 Montague House 5 Hardwicke House 6 Chancery Building and Chancery Apartments 7 Hanover Building 8 1WML 9 Observatory 10 Guild House (Two Dockland Central) 11 One Dockland Central 12 The Forum 13 1SJRQ 14 Cumberland House 15 Harcourt Square 16 Dundrum View 17 Central Quay 18 One Earlsfort Terrace 19 Marine House & Clanwilliam Court
3
M1 M50 M50 N3/M3 N2/M2 M50
Dublin
N81
Howth Clontarf Dublin Airport North Bull Island Portmarnock Blanchardstown Clondalkin Tallaght Blackrock Ballsbridge Rathfarnham Phibsborough Drumcondra Castleknock Sutton Northern Cross Beaumont Ballymun The Ward Northwest Business Park Glenageary Dundrum Palmerstown Kimmage
N11
Ballymount
N4/M4 N7/M7
1 Wyckham Place 3 Gateway Site 16 Dundrum View
1 &16 3 17 18 19
CBD
1 &16 Herbert Park
Source: Google Maps, Visit Dublin, Jones Lang LaSalle (1) Property assets > €5m in value as at 31 Mar 2017
Dublin Overview(1) Central Dublin portfolio(1)
12 mths to 31-Mar-17 12 mths to 31-Mar-16(2) Revenue 46,372 32,786 Rental income 42,519 32,786 Direct property costs (2,838) (2,497) Property Income 39,681 30,289 Performance related fees (8,215) (6,069) Administrative expenses (12,770) (8,696) Net finance (costs) (5,661) (4,087) Net rental profit 13,035 11,437 Revaluation/other income: Investment properties 103,525 125,056 Other income/ (costs)(3) 2,476 (171) Tax (expense)/ credit (450) 475 Total revaluation/other income: 105,551 125,360 Profit for the financial period 118,586 136,797 Diluted IFRS EPS (cents) 17.2 20.1 EPRA Earnings 14,989 10,024 EPRA EPS (cents) 2.2 1.5 31-Mar-17 31-Mar-16 Investment property(1) 1,167,387 927,656 Assets held for sale 385 3,921 Other non current assets 13,604 14,977 Cash and cash equivalents 18,148 23,187 Trade and other receivables 10,108 18,880 Gross assets 1,209,632 988,621 Current liabilities (24,642) (19,323) Financial liabilities (171,138) (72,724) Net assets 1,013,852 896,574 Equity share capital 678,110 672,398 Retained earnings 346,738 228,172 Dividends paid (20,755) (10,132) Other reserves 9,759 6,136 Total equity 1,013,852 896,574 IFRS NAV per share (cents) 147.9 131.6 Diluted IFRS NAV per share (cents) 146.3 130.7 EPRA NAV per share (cents) 146.3 130.8
41
(€ in thousands) (€ in thousands)
(1) Prior year figures incl. 50% interest in Windmill Lane only (2) Figures inclusive of surrender premium (€4.9m) (3) Profits arising on disposal of non-core properties, development management & promote fees earned and fair value movements on shares issued
Balance sheet highlights Summary income statement
1.3m 1.6m 2.4m 3.0m 1.1m 1.8m 1.7m 2.7m 1.1m 2.1m 1.6m 2.6m 3.2m 0.0m 0.5m 1.0m 1.5m 2.0m 2.5m 3.0m 3.5m 2016 @ Mar 16 2016 @ Sep 16 2016 2017 @ Mar 16 2017 @ Sep 16 2017 2018 @ Mar 16 2018 @ Sep 16 2018 2019 @ Mar 16 2019 @ Sep 16 2019 2020 Potential sq. ft. Expected year of completion
42
Under Construction Planning Granted Planning Applied Pre-Planning Completed Pre-let CBRE 10yr avg. CBD take-up = 1.3m sq. ft. CBRE 2016 take-up = 2.6m sq. ft. CBRE 10yr avg. take-up = 1.9m sq. ft. 2020 not analysed at Mar 16 2020 not analysed at Sep 16
Source: Hibernia/CBRE estimates
Estimated development/refurbishment pipeline
43 To earlier of rent review or lease expiry
Weighted average period to rent review or lease expiry of 3.2yrs excl. completed developments(2) Current in-place office contracted rent: €38.0m
€0m €2.0m €4.0m €6.0m €8.0m €10.0m €12.0m Sep-17 Mar-18 Sep-18 Mar-19 Sep-19 Mar-20 Sep-20 Mar-21 Sep-21 Mar-22 Contracted Rent Six months ended Valuers' ERV @ 31 Mar 17
(1) To earlier of rent review or lease expiry. Excludes various parking licenses, retail space in office buildings, Parkrite in the Forum/Clanwilliam, Crossfit, Roof Antenna & AIB ATM. Also excludes any rent review dates or expiries prior to Mar 17 (2) i.e. the ‘acquired in-place office’ portfolio (3) Note: Harcourt Square lease (€6.1m) expiry in Dec-2022 (y/e Mar-23) is excluded from the chart as well as current rent reviews