Preliminary Results from GMDs Halocarbons and other Trace Gases - - PowerPoint PPT Presentation

preliminary results from gmd s halocarbons and other
SMART_READER_LITE
LIVE PREVIEW

Preliminary Results from GMDs Halocarbons and other Trace Gases - - PowerPoint PPT Presentation

Preliminary Results from GMDs Halocarbons and other Trace Gases Measurements on Atmospheric Tomography Mission (ATom) Tomography is imaging by sections or sectioning. . Primary science goal: Measure the chemical reactivity of the troposphere


slide-1
SLIDE 1

Preliminary Results from GMD’s Halocarbons and other Trace Gases Measurements on Atmospheric Tomography Mission (ATom)

J.W. Elkins1, F.L. Moore2,1, E.J. Hintsa2,1, E. Ray2,3, G.S. Dutton2,1, J.D. Nance2,1, B.D. Hall1, S.A. Montzka1, C. Sweeney1, B.R. Miller2,1, E.J. Dlugokencky1, P.A. Newman4 and S.C. Wofsy5

1NOAA/GMD, 2CIRES, 3NOAA/CSD, 4NASA GSFC, & 5Harvard

NOAA GMAC, Wednesday, May 23, 2018

Primary science goal: Measure the chemical reactivity of the troposphere and how it is modified by human pollution and the effect of air quality on climate using the NASA DC-8 aircraft.

1

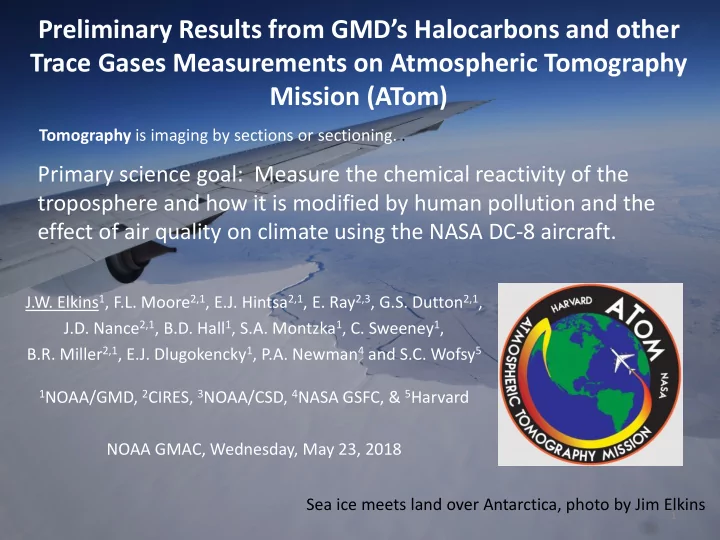
Tomography is imaging by sections or sectioning. . Sea ice meets land over Antarctica, photo by Jim Elkins

slide-2
SLIDE 2

ATom Management

  • Funded by NASA Earth Venture

Suborbital 2 (EVS-2), 5 yr.; Barry Lefer, NASA, New Headquarters Lead

  • Steve Wofsy, Harvard, Principal

Investigator

  • Michael Prather, UCI, Deputy PI
  • Tom Ryerson, NOAA CSD, Science

Team Lead and DC-8 Instrument Coordinator

  • Dave Jordan, NASA, Project

Manager

  • Paul Wennberg, CIT, Paul Newman

& Tom Hanisco (GSFC), ATom-3 Mission Scientists

2

Photo by Jim Elkins

NASA DC-8 aircraft: Built in 1957

Photo by J. Elkins

slide-3
SLIDE 3

Instruments on NH Spring (ATom-4)

  • AMP (Brock) Aerosol size
  • AO2 (Stephens) O2
  • ATHOS (Brune) OH,HO2
  • CAFS (Hall) Actinic flux
  • CANOE% (Hanisco) NO2
  • CAPS (Weinziert*) Aerosol size & cloud H2O
  • CIT-CIMS (Wennberg) HNO3,H2O2
  • DLH (Diskin) H2O
  • GT-CIMS (Huey) PAN
  • HR-AMS (Jimenez) CI,NH4,NO3
  • HTS/QCLS (Daube) CO,CO2,CH4,N2O
  • ISAF (Hanisco) CH2O
  • Medusa (Keeling) O2,CO2,N2,Ar
  • MMS (Bui) Met data
  • NOAA CIMS# (Ryerson) Cl2, BrCl, N2O5
  • NOAA Picarro (McKain) CO2,CH4,CO
  • NOyO3 (Ryerson) NO,NO2,NOy,O3
  • PALMS (Murphy) Particle Composition
  • PANTHER (Elkins) PAN, halocarbons
  • PFP (Montzka) hydro- & halo-carbons
  • SAGA (Dibb) Aerosols
  • SP2 (Schwarz) Black Carbon
  • SO2%(Rollins) SO2
  • SOAP% (Wagner) Aerosol absorption &

extinction

  • TOGA (Apel) VOCs
  • UCATS (Elkins) O3,H2O,SF6,N2O,H2,CO,CH4
  • WAS (Blake) hydro-,halo-carbons
  • Ozonesondes (Johnson) O3, RH%, T, P
  • 28 instruments in total
  • 7 from Universities
  • In red, 12 instruments from NOAA/ESRL, plus

weather guidance (Ray/Rosenlof)

  • In blue, 4 NCAR instruments + QCLS
  • In purple, 4 NASA center instruments, plus

weather, flight tracks, and forecasting from GFSC (Newman)

  • Many modeling teams from University NOAA

and NASA.

  • Over 330 atmospheric parameters measured

____________________________________

  • *University of Vienna (Wien), Austria
  • #Added for NH Fall (ATom-3)
  • %Added for NH Spring (ATom-4)

3

slide-4
SLIDE 4

Flight Tracks of ATom

  • “Round the World” circuit:

~12 research flights

  • Mission: 4 circuits, one for

each season over 3 years.

  • Vertical profiles: 500’ (150 m)

to 42,000’ (13 km)

  • 4 to 9 vertical profiles/flight
  • NASA Frequent Flyer Miles: 1

circuit = 40,540 miles (57,500 km). Total (4 circuits)=161,750 miles (258,800 km)

4

Circles HATS stations; Names of Stops

slide-5
SLIDE 5

NH Summer Long-lived Halocarbons (ATom-1)

CFC Replacement

Regulated gas by Montreal Protocol

PANTHER MSD & ECD channel – Moore, Hintsa, & Elkins HFC-134a CFC-11

5

slide-6
SLIDE 6

NH Summer & Winter SF6

NH Summer More mixing across ICTZ NH Winter Less mixing across ITCZ

Combined data from PANTHER/UCATS

6

slide-7
SLIDE 7

Age from NH Mid-Latitude Pollution (Waugh et al., 2013)

NH Summer Age(yr.)=(9.1-SF6)/0.32 NH Winter Age(yr.)=(9.25-SF6)/0.32

7

Stratospheric Air

slide-8
SLIDE 8

ATom Meteorology

8

NH Summer NH Winter

Plots from P. Newman

slide-9
SLIDE 9

HCFC-22 CH2Cl2 Latitude HCFC-22 (ppt) CH2Cl2 (ppt)

Elevated mole fractions observed In many gases, more prominently in the Pacific than the Atlantic Co-variations for elevated HCFC-22 and CH2Cl2 points to a common source for these elevations, likely East Asia (high HCFC-22 production remains only there)

Long-range transport of industrial solvents: ATom-1

Data from PFPs, Montzka, P.I.

9

slide-10
SLIDE 10

20 40 60 80 100 120 140 160 180 200

  • 90
  • 60
  • 30

30 60 90 210 220 230 240 250 260 270 280

  • 90
  • 60
  • 30

30 60 90 20 40 60 80 100 120 140 160 180 200 210 220 230 240 250 260 270 280

HCFC-22 CH2Cl2 Latitude

Long-range transport of industrial solvents: ATom-2

HCFC-22 (ppt) CH2Cl2 (ppt)

Note much different scale for CH2Cl2 during ATom2  NH winter Elevated mole fractions observed In many gases, more prominently in the Pacific than the Atlantic Even tighter correlation in NH winter Data from PFPs, Montzka, P.I.

10

slide-11
SLIDE 11

Summary of ATom

  • All four ATom seasonal circuits are

almost completed, ATom-4 going on

  • now. ATom-1 and ATom-2 data are

publicly available for flights before 03/01/2017.

  • ATom-3 data release date is

07/31/2018.

  • SF6 and halocarbons make useful tracers
  • f air mass motion & sources.
  • On personal note, we are seeing striking

impacts in biomass burning and desert dust over the middle of the oceans, lack

  • f sea ice near Barrow, Alaska and off

Greenland in NH winter.

11

NH Summer (ATom-1) & NH Summer (ATom-2) data are available publicly at https://espoarchive.nasa.gov/archive/browse/atom

slide-12
SLIDE 12

12

Sahara dust and smoke in lower troposphere between equator and Azores over 1000s km east from Africa. Photo: J. Elkins

Questions?

Thanks to the crew of the NASA DC-8