Predicting Computer System Failures Using Support Vector Machines - - PDF document

predicting computer system failures using support vector
SMART_READER_LITE
LIVE PREVIEW

Predicting Computer System Failures Using Support Vector Machines - - PDF document

Predicting Computer System Failures Using Support Vector Machines Errin W. Fulp a Glenn A. Fink b Jereme N. Haack b a Wake Forest University b Pacific Northwest National Department of Computer Science Laboratory Winston-Salem NC, USA Richland


slide-1
SLIDE 1

Predicting Computer System Failures Using Support Vector Machines

Errin W. Fulpa Glenn A. Finkb Jereme N. Haackb

aWake Forest University

Department of Computer Science Winston-Salem NC, USA

bPacific Northwest National

Laboratory Richland WA, USA Pacific Northwest

NATIONAL LABORATORY

USENIX Workshop on the Analysis of System Logs December 7, 2008

System Event Prediction 1

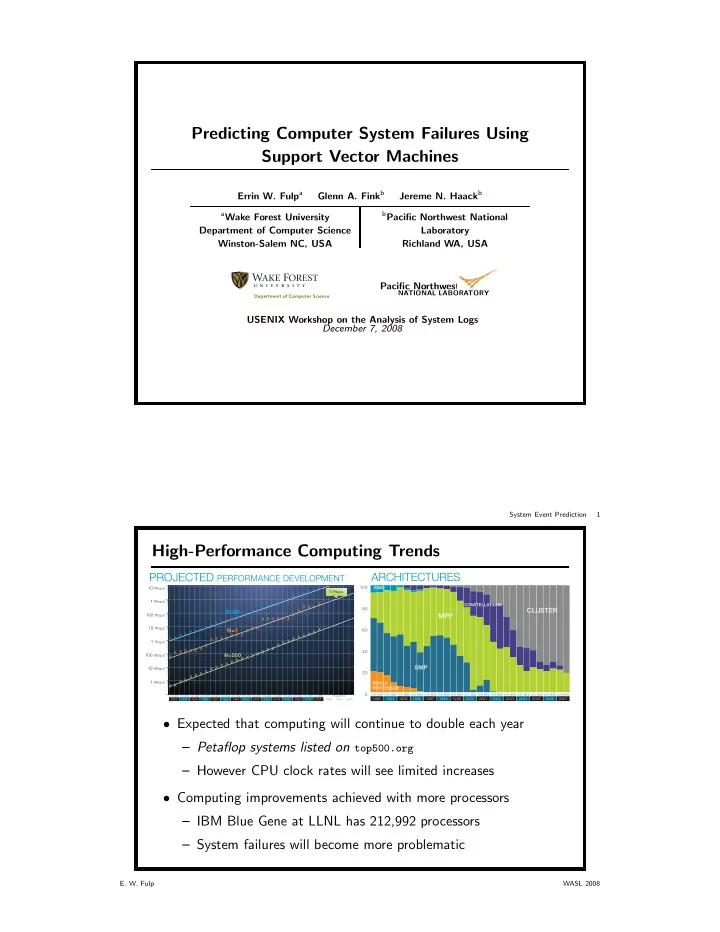
High-Performance Computing Trends

PROJECTED PERFORMANCE DEVELOPMENT

X X X X X X X X X X X X X X X X X X X X X X X X X X X X X X X X X X X X X X X X X X X X X X X X X X X X X X X X X X X X X X X X X X X X X X X X X X X X X X X X X X X X X X X X X X 1 Gflop/s 10 Gflop/s 100 Gflop/s 1 Tflop/s 10 Tflop/s 100 Tflop/s 1 Pflop/s 10 Pflop/s

SUM N=1

N=500

JUN JUN JUN JUN JUN JUN JUN JUN JUN JUN JUN JUN JUN JUN JUN NOV NOV NOV NOV NOV NOV NOV NOV NOV NOV NOV NOV NOV NOV NOV

1993 1994 1995 1996 1997 1998 1999 2006 2007 2000 2001 2002 2003 2004 2005 2009 2010 2008

PROJECTED

1 Pflop/s

ARCHITECTURES

20 40 60 80 100

CLUSTER

CONSTELLAT A IONS SIMD

MPP

SMP

SINGLE PROCESSOR

JUN JUN JUN JUN JUN JUN JUN JUN JUN JUN JUN JUN JUN JUN JUN NOV NOV NOV NOV NOV NOV NOV NOV NOV NOV NOV NOV NOV NOV NOV

1993 1994 1995 1996 1997 1998 1999 2006 2007 2000 2001 2002 2003 2004 2005

  • Expected that computing will continue to double each year

– Petaflop systems listed on top500.org – However CPU clock rates will see limited increases

  • Computing improvements achieved with more processors

– IBM Blue Gene at LLNL has 212,992 processors – System failures will become more problematic

  • E. W. Fulp

WASL 2008

slide-2
SLIDE 2

System Event Prediction 2

System Events

  • There are several critical system events

– Hardware failure, software failure, and user error – Frequency will increase as systems become larger (cluster) – Resulting in lower overall system utilization

  • Cannot easily improve failure rates, can we manage failure?

– Smarter scheduling of applications and services – Minimize the impact of failure

  • Accurate event predictions are key for event management

– Are predictions possible? How accurate? – Need system status information to make predictions

  • E. W. Fulp

WASL 2008 System Event Prediction 3

System Status Information

  • Almost every computer maintains a system log file

– Provide information about system events – syslog is actually general-purpose logging facility [Lon01]

  • An event represents a change in system state

– Include hardware failures, software failures, and security

Host Facility Level Tag Time Message 198.129.8.6 kern alert 1 1171062692 kernel raid5: Disk failure on sde1, disabling device

  • Entries contain information such as: time, message, and tag

– Time identifies when the message was recorded – Message describes the event, typically natural language – Tag represents criticality, low values are more important

  • E. W. Fulp

WASL 2008

slide-3
SLIDE 3

System Event Prediction 4

Log Files

Host Facility Level Tag Time Message 198.129.8.6 local7 notice 189 1171061732 sysstat 198.129.8.6 kern info 6 1171061732 kernel md: using maximum available idle IO bandwidth 198.129.8.6 cron info 78 1171061733 crond 2500 (root) CMD (/usr/lib/sa/sa1 1 1) 198.129.8.6 auth info 38 1171062445 rsh(pam unix) 2215 session opened for user by (uid=0) 198.129.8.6 auth info 38 1171062445 in.rshd 2216 root@hpcs2.cs.edu as root: cmd=/root/temps 198.129.8.6 daemon info 30 1171062590 smartd 88 Device: /dev/twe0 SMART Prefailure Attribute 198.129.8.18 syslog info 46 1171062590 syslogd restart. 198.129.7.282 daemon info 30 1171062590 ntpd 2555 synchronized to 198.129.149.218, str 198.129.7.222 daemon info 30 1171062590 ntpd 2555 synchronized to 198.129.149.218, str 198.129.7.238 daemon info 30 1171062590 ntpd 2555 synchronized to 198.129.149.218, str 198.129.8.6 auth notice 37 1171062590 sshd(pam unix) 12430 auth failure; logname=el-fork-o 198.129.8.6 kern info 6 1171062590 kernel md: using 512k, over a total of 12287936 blocks. 198.129.8.6 cron info 78 1171062601 crond 2500 (root) CMD (/usr/lib/sa/fork-it 1 1) 198.129.8.6 kern alert 1 1171062692 kernel raid5: Disk failure on sde1, disabling device

  • Log file is a list of messages, can be analyzed for

– Auditing, determine the cause of an event (past) – Predicting important events (future)

  • E. W. Fulp

WASL 2008 System Event Prediction 5

Example System Event to Predict

  • An interesting event is disk failure

– By 2018 [large systems] could have 300 concurrent reconstructions at any time [SG07] – Predicting disk failure is important – Easy to identify event in the log...

  • Predict failure as early as possible

– n messages M = {m1, m1, ..., mn} – Assume mn is the event – Min depth d and max lead l

  • Are all messages the same?

M depth lead time

  • E. W. Fulp

WASL 2008

slide-4
SLIDE 4

System Event Prediction 6

SMART

  • Self-Monitoring Analysis & Reporting Technology (SMART)

– SMART disks monitor their health and performance – Attributes describe current state, each attribute has unique ID

  • Many different types of messages (Attribute and Value)

Attribute Meaning 1 Raw Read Error Rate changed to x 190 Airflow Temperature changed to x 2 Throughput Performance 8 Seek Time Performance 201 Soft Read Error Rate changed to x

  • Pinheiro et.al. investigated Google hard drive failure [PWB07]

– Some SMART parameters do correlate with drive failure – Conclude SMART messages alone may not be sufficient

  • E. W. Fulp

WASL 2008 System Event Prediction 7

Disk Failure Prediction

  • What features (information) should be considered?

– A message contains criticality, message, and time – Is there a series of messages that tend to be a precursor?

  • Consider a sequence of messages arriving (ordered by time)

– Is it possible to classify into failure and non-failure classes? – Other approaches have considered Bayesian Nets and HMM

1.1778 1.1779 1.178 1.1781 1.1782 1.1783 1.1784 1.1785 x 10

9

50 100 150 200 time (seconds) tag number h198.129.146.158 1.1778 1.1779 1.178 1.1781 1.1782 1.1783 1.1784 1.1785 x 10

9

50 100 150 200 time (seconds) tag number h198.129.146.227 1.1778 1.1779 1.178 1.1781 1.1782 1.1783 1.1784 1.1785 x 10

9

50 100 150 200 time (seconds) tag number h198.129.149.180

  • E. W. Fulp

WASL 2008

slide-5
SLIDE 5

System Event Prediction 8

Support Vector Machines

  • Support Vector Machine (SVM) is a classification algorithm

– Consider a set of samples from two different classes – Each vector consists of features describing the sample – SVM finds a hyperplane separating the classes in hyperspace – The vectors closest to the plane are the support vectors

  • Great for aggregate statistics, what about series?

– Interested in using sequences of messages as features

  • E. W. Fulp

WASL 2008 System Event Prediction 9

Spectrum Kernel

  • A spectrum kernel considers k length sequences as features

– The frequency of the sequence is the feature value

  • Assume two symbols {A, B} and sequence length k = 2

– There are 2k possible sequences (features) (AA, AB, BA, BB) – Value of a feature is the number of occurrences

M = {A, A, B, A, A, B, B, A}

AA: 2 AB: 2 BA: 2 BB: 1 – There are bk possible sequences, were b is number of symbols

  • How does this work for syslog messages?
  • E. W. Fulp

WASL 2008

slide-6
SLIDE 6

System Event Prediction 10

tag Sequences

  • Each message has a tag that indicates criticality

– Sequence of messages represented by sequence of tag values

1.1778 1.1779 1.178 1.1781 1.1782 1.1783 1.1784 1.1785 x 10

9

50 100 150 200 time (seconds) tag number h198.129.146.158

  • 50

50 100 150 200 0.05 0.1 0.15 0.2 0.25 0.3 0.35 0.4 percent of all messages tag number Example tag Levels

– Need to reduce number of symbols, assume three levels – high (tag < 10), medium (10 <tag< 140), low (tag> 140)

  • Given a series of messages M, process using a sliding window

– Count the number of occurrences of k-length sequences

  • E. W. Fulp

WASL 2008 System Event Prediction 11

Example tag Processing

  • Let M = {148, 148, 158, 40, 158, 188, 188, 88, 158, 188}
  • Assume b = 3 and k = 5, then 35 = 243 possible features

tag Encoding (e) Sequence f (base 10) 148 2 2 148 2 22 158 2 222 40 1 2221 158 2 22212 239 188 2 22122 233 188 2 21222 215 88 1 12221 160 158 2 22212 239 188 2 22122 215

  • Feature number is ft+1 =

mod (b · ft, bk) + e

  • Vector for M would be (160:1, 215:2, 233:1, 239:2)
  • E. W. Fulp

WASL 2008

slide-7
SLIDE 7

System Event Prediction 12

System Data used for Experiments

  • About 24 months of syslog files from 1024 node Linux cluster

– Averaged 3.24 messages an hour (78 a day) per machine – Observed 120 disk failure events

20 40 60 80 100 0.05 0.1 0.15 0.2 0.25 0.3 0.35 0.4 0.45 0.5 tag number percent of all messages Distribution of Message tags and Intervals Used Non-fail disk Fail disk 110 120 130 140 150 160 170 180 0.05 0.1 0.15 0.2 0.25 0.3 0.35 0.4 0.45 0.5 tag number percent of all messages Distribution of Message tags and Intervals Used Non-fail disk Fail disk

  • Tag values ranged from 0 to 189

– 61 unique tag messages were observed during this time

  • E. W. Fulp

WASL 2008 System Event Prediction 13

Prediction Experiments

  • Sets of M =1200 messages (15 days) collected per machine

– From first message, processed d = {400, 600, 800, 1000, 1100}

  • One SVM considered aggregate features occurring within d

– Number of occurrences for each tag value

  • Another SVM also considered tag sequences occurring within d

– Sequences consisted of 5 messages, there were 19 tag ranges

M time

d = 400 d = 600 d = 800 d = 1000 d = 1200 50 100 150 0.05 0.1 0.15 0.2 0.25 0.3 0.35 tag number percent of all messages Distribution of Message tags and Intervals Used

  • E. W. Fulp

WASL 2008

slide-8
SLIDE 8

System Event Prediction 14

Prediction Results

  • Accuracy, precision, recall, and ROC recorded per experiment

– Where acc= T P +T N

P +N , prec= T P T P +F P , and recall= T P P

400 600 800 1000 1200 50 55 60 65 70 75 80 85 90 95 100 number of messages processed (M) percent accuracy Percent Accuracy as Number of Messages Increases combined features aggregate features failure event 400 600 800 1000 1200 50 55 60 65 70 75 80 85 90 95 100 number of messages processed (M) precision Precision as Number of Messages Increases combined features aggregate features failure event

  • More messages improved prediction results
  • Combined were better, 73% accuracy with 200 message lead
  • E. W. Fulp

WASL 2008 System Event Prediction 15

Prediction Results

400 600 800 1000 1200 50 55 60 65 70 75 80 85 90 95 100 number of messages processed (M) percent recall Percent Recall as Number of Messages Increases combined features aggregate features failure event 0.2 0.4 0.6 0.8 1 0.1 0.2 0.3 0.4 0.5 0.6 0.7 0.8 0.9 1 false positive rate true positive rate ROC for Different SVM Classifiers combined at 1000 msg aggregate at 1000 msg combined at 400 msg aggregate at 400 msg random guess

  • ROC curve can be used to compare classifiers/predictions [Faw06]

– Closer to the north-west, the better the performance – Some issues with false negatives

  • Combined features performed better, typically 4% to 5% increase
  • E. W. Fulp

WASL 2008

slide-9
SLIDE 9

System Event Prediction 16

Feature Weights

  • Use of a linear kernel for the SVM allows for feature analysis

– Larger weight (positive or negative) indicates a feature useful

50 100 150

  • 0.03
  • 0.02
  • 0.01

0.01 0.02 0.03 feature weight Feature Weights for Failure Prediction 0.5 1 1.5 2 2.5 3 x 10

6

  • 0.03
  • 0.02
  • 0.01

0.01 0.02 0.03 feature weight Feature Weights for Failure Prediction

  • Of 2,476,289 features, only 2,251 were useful

– Of the useful features 22 were aggregate, remaining were sequences

  • E. W. Fulp

WASL 2008 System Event Prediction 17

Runtime Performance

  • For the combined feature experiments

– Training time averaged 7 minutes 38 seconds – Tesing time averaged 0.21 seconds

  • E. W. Fulp

WASL 2008

slide-10
SLIDE 10

System Event Prediction 18

Conclusions and Future Work

  • Using syslog data to predict disk failures

– Spectrum-kernel SVM predicted with 73% 100 msg lead – Message sequences did improve performance

  • Several areas for improvement

– determine k and b, add new features, ... – How does message rate impact performance? – Need more and different data

  • Consider other interesting events

– Other failures, since disk failure = node failure – Can this be useful for security? – Multi-system analysis

  • Possible to create a reduced message system? [YM05]
  • E. W. Fulp

WASL 2008 System Event Prediction 19

References

[Faw06] Tom Fawcett. An introduction to roc analysis. Pattern Recognition Letters, 7, 2006. [Lon01]

  • C. Lonvick. The BSD Syslog Protocol. RFC 3164 (Informational), August 2001.

[PWB07] Eduardo Pinheiro, Wolf-Dietrich Weber, and Luiz Andr´ e Barroso. Failure trends in a large disk drive population. In Proceedings of the USENIX Conference on File and Storage Technologies, pages 17–29, 2007. [SG07] Bianca Schroeder and Garth A Gibson. Understanding failures in petascale computers. Journal of Physics: Conference Series, (28), 2007. [YM05] Kenji Yamanishi and Yuko Maruyama. Dynamic syslog mining for network failure monitoring. In Proceedings of the Eleventh ACM SIGKDD International Conference on Knowledge Discovery in Data Mining, pages 499–508, 2005.

  • E. W. Fulp

WASL 2008

slide-11
SLIDE 11

System Event Prediction 20

Other Prediction Stats

Accuracy M = 400 600 800 1000 1100 Agg 64 65 65 68 70 Comb 67 69 72 73 74 Precision M = 400 600 800 1000 1100 Agg 64 66 67 69 72 Comb 67 69 72 73 74 Recall M = 400 600 800 1000 1100 Agg 62 63 63 66 66 Comb 63 66 68 69 70 F-score M = 400 600 800 1000 1100 Agg 63 64 65 67 69 Comb 66 68 71 71 73

  • E. W. Fulp

WASL 2008