
SLIDE 1
Poughkeepsie Dutchess County Transportation Council Required - - PDF document
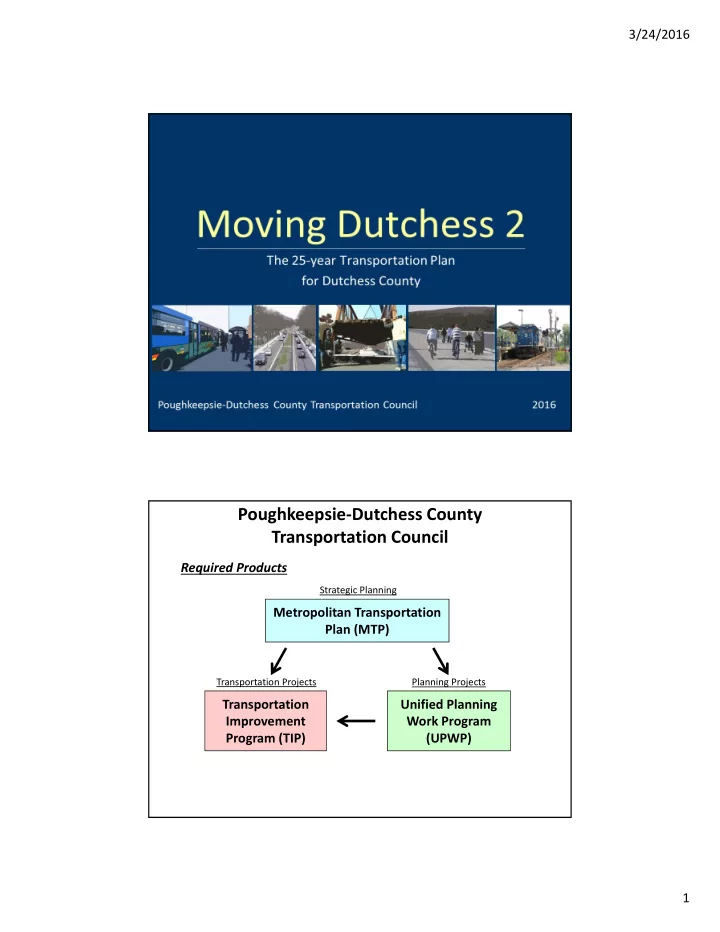
3/24/2016 Poughkeepsie Dutchess County Transportation Council Required Products Strategic Planning Metropolitan Transportation Plan (MTP) Transportation Projects Planning Projects Transportation Unified Planning Improvement Work Program Program
2016
Dutchess County Population (2010) Total Population = 297,488 Total Urbanized Area Population = 212,235 Percent in Urbanized Area = 71% Percent in Adjusted Urbanized Area = 76% Dutchess County Portion of the Poughkeepsie‐Newburgh NY‐NJ Urbanized Area (2010)
Target Populations by Percent of Dutchess County Population
14% 11% 14% 13% 9% 3%
0% 5% 10% 15% Total Minority Population Total Hispanic Population Population Aged 65 and Over Disabled Population Low Income Population LEP Population
2010 Population Above Average for Total Minority 2010 Population Above Average for Total Hispanic
2010‐2014 ACS 5‐year Estimates Above Average for Low Income 2010‐2014 ACS 5‐year Estimates Above Avg. for Limited English Proficiency (LEP)
Number of Standard Vehicle Registrations Number of Driver Licenses
Highest in County History
Jurisdiction Total Centerline Mileage Percent of Total Mileage Total Federal‐ Aid Eligible Percent Federal‐ Aid Eligible NYSDOT 405 16% 396 98% Dutchess County 394 16% 151 38% Town 1,473 59% 44 3% City or Village 187 8% 40 22% Other 32 1% 3 9% Total 2,491 634 25%
68% 16% 16% <1% Local NYSDOT Dutchess County Other
Average Condition Rating Number Rated Deficient Percent Deficient NYSDOT 5.1 66 49 Dutchess County 5.0 60 43 Local 4.6 22 41 Other 5.6 5 15 Number of Bridges Percent of Total NYSDOT 135 37 Dutchess County 141 39 Local 54 15 NYSBA 3 1 NPS 5 1 Other 26 7 Bridge Jurisdiction Bridge Ratings NEW 7 6 5 4 3 2 1 GOOD DEFICIENT
CR 72 (North Ave.) bridge looking from CR 73 (Sherow Rd.) NYS Route 115 bridge looking north in Salt Point.
1/17/2009 Service Change & 7/1/2009 Fare Increase
1/1/2013 Fare Increase
Line Station
INBOUND BOARDINGS
INBOUND BOARDINGS Poughkeepsie 1,736 3,260 New Hamburg 1,035 1,003 Beacon 2,498 2,986 Total Hudson Line 5,269 7,249 Wassaic 250 632 Tenmile River 28 54 Dover Plains 123 132 Harlem Valley‐Wingdale 114 147 Appalachain Trail na 4 Pawling 257 228 Total Harlem Line 772 1,197 Total 6,041 8,446 Hudson Harlem
Beacon & Poughkeepsie Stations account for
boardings
High = 46 Low = 13
500 1,000 1,500 2,000 2,500 3,000 3,500 4,000 2004 2005 2006 2007 2008 2009 2010 2011 2012 2013 2014
High = 3,804 Low = 2,402
Crash Conditions Number of crashes Percent of Total Crashes Number of Fatalities Percent of Total Fatalities Number of Injuries Percent of Total Injuries Weather Conditions Clear 21,486 57% 65 59% 7,275 57% Cloudy 9,041 24% 30 27% 3,245 25% Rain 3,853 10% 11 10% 1,477 12% Snow 1,800 5% 2 2% 457 4% Other1 1,502 4% 2 2% 309 2% Light Conditions2 Daylight 24,897 66% 67 61% 9,241 72% Dawn 797 2% 2 2% 172 1% Dusk 1,119 3% 1 1% 339 3% Dark‐Road Lighted 3,888 10% 11 10% 1,439 11% Dark‐Road Unlighted 6,059 16% 28 25% 1,433 11% Road Conditions Dry 27,239 72% 86 78% 9,312 73% Wet 6,652 18% 20 18% 2,581 20% Snow/Ice 2,600 7% 2 2% 648 5% Other3 1,191 3% 2 2% 222 2% Total 37,682 110 12,763
1 Other includes sleet, hail, freezing rain, fog, and smoke. 2 Light conditions were not identified for 851 crashes that resulted in one fatality and 139 injuries. 3 Other includes muddy, slushy, or flooded road.
Crash Characteristics Number of crashes Percent of Total Crashes Number of Fatalities Percent of Total Fatalities Number of Injuries Percent of Total Injuries Crash Type Other Motor Vehicle 22,850 61% 36 33% 8,953 70% Pedestrian 435 1% 8 7% 419 3% Bicyclist 216 1% 3 3% 184 1% Deer 4,820 13% 0% 187 1% Animal 599 2% 0% 18 0% Fixed Object1 7,648 20% 59 54% 2,598 20% No Collision 759 2% 3 3% 325 3% Other2 355 1% 1 1% 79 1% Traffic Control None 18,861 50% 51 46% 4,946 39% Traffic Signal 6,062 16% 4 4% 3,072 24% Stop Sign 2,247 6% 3 3% 1,054 8% Yield Sign 802 2% 0% 222 2% No Passing Zone 7,412 20% 47 43% 2,798 22% Other3 2,298 6% 5 5% 671 5% Total 37,682 110 12,763
1 Fixed objects include utility poles, guiderails, trees, sign posts, fences, earth embankments, and culverts. 2 Other includes unspecified crash types. 3 Other includes a flashing light, officer/guard, railroad crossing sign, construction work area, and school zone.
326,000 ‐ 337,000
‐ New measure or data unavailable. ‐ 2015 goal achieved. ‐ 2015 goal not achieved, but progress made. ‐ 2015 goal not achieved.
City of Poughkeepsie Public Workshop
Regionally significant, long‐ range projects that will require funding above and beyond normal FHWA and State allocations (>$100 million).
Route 82 Market St.
Route 44/55 HAL CR 28 (Old Hopewell Rd.)/CR 94 (All Angels Hill Rd.)
Route 113 (Spackenkill Rd.) Creek Rd.
˗ Bridges: $16,000 per foot (avg. statewide repair cost 2012‐2014) ˗ Road Repaving: $150,000 per mile (single‐course overlay) ˗ Intersections: Case‐by‐case cost (recent TIP projects) ˗ Safety: Case‐by‐case cost (recent TIP projects) ˗ Sidewalk with Curbing: $200 per foot ˗ Heavy‐Duty Bus: $400,000 per vehicle ˗ Medium‐Duty Bus: $135,000 per vehicle ˗ Bridges: $5 million annually ˗ Roads: $5 million annually ˗ Traffic Operations: $1.5 million annually ˗ Safety Activities: $2 million annually ˗ Operating Assistance: $1.3 million annually ˗ Preventive Maintenance: $2 million annually Highway Transit Highway Transit
69% ‐ Highway & Bridge 18% ‐ Transit 8% ‐ Safety 5% ‐ Pedestrian‐Bicycle <1% ‐ Planning
FFY 2016 YOE1 $283,400,000 $339,560,000 $227,160,000 $286,800,000 $156,150,000 $208,678,000 $79,750,000 $93,985,000 $43,345,000 $57,003,000 $7,550,000 $7,560,000 $178,790,000 $220,858,000 $3,730,000 $4,135,000 $979,875,000 $1,218,579,000 Planning Studies Total Pedestrian Bicycle Safety Transit Federal-aid Eligible Project Type Bridge Maintenance Highway-Maintenance Highway-Operations Travel Demand Management 28% 23% 17% 8% 5% 1% 18% <1%
Bridge Maintenance Highway‐Maintenance Highway‐Operations Highway‐Operations Safety Pedestrian‐Bicycle Travel Demand Management (TDM) Transit Planning Studies
YOE based on 2% annual inflation
State & Local projects
FTA Section 5307 & 5339
Recommended Available Balance $951,526,000 $822,816,500 ‐$128,709,500 $220,858,000 $280,000,000 $59,142,000 $11,695,000 $20,662,500 $8,967,500 $1,184,079,000 $1,123,479,000 ‐$60,600,000
1 Funding amounts rounded to the nearest hundred‐thousand.
Overall Planning Period (2016‐2040) Planning Studies Highway & Bridge Projects Federal‐aid Eligible Sub‐totals1 Total Transit Projects 60% 38% 2% Federal State Local
Route 216 /Beacon Line in East Fishkill