
SLIDE 1
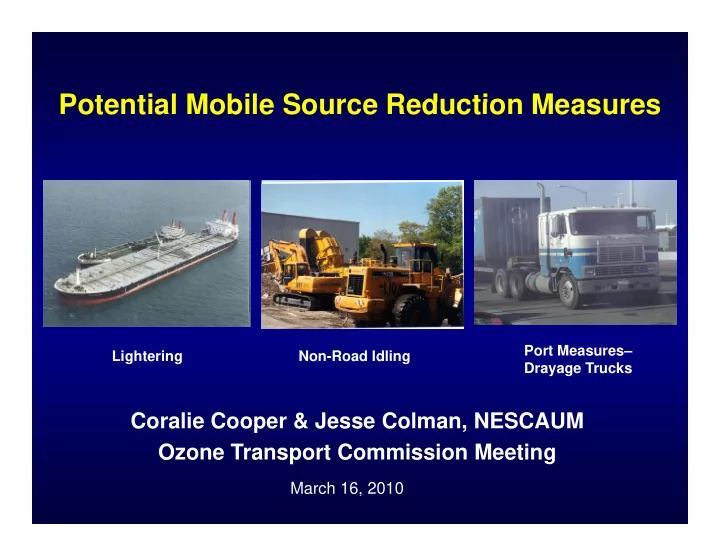
Potential Mobile Source Reduction Measures Potential Mobile Source Reduction Measures
Non-Road Idling Lightering Port Measures– Drayage Trucks
Potential Mobile Source Reduction Measures Potential Mobile Source - - PowerPoint PPT Presentation
Potential Mobile Source Reduction Measures Potential Mobile Source Reduction Measures Port Measures Lightering Non-Road Idling Drayage Trucks Coralie Cooper & Jesse Colman, NESCAUM Ozone Transport Commission Meeting Ozone Transport
Non-Road Idling Lightering Port Measures– Drayage Trucks
2
3
Source: US EPA’s AP-42
4
5
Area Product Volume (million BBLs) VOC Emissions (tons) 57% Reduction (tons) 95% Reduction (tons) Narragansett Bay Gasoline, Kerosene 0.2 4 2 4 Long Island Sound Finished Products 1 4 99 56 94 Sound Products 1.4 99 56 94 New York Harbor Gasoline, Fuel Oil, Other 48.3 889 506 844 l d Delaware Bay Crude 98.8 1,956 1,115 1,858 Chesapeake Bay Gasoline 0.3 11 6 10 TOTAL 2,959 570* 1,695*
*Beginning May 1, 2012, Delaware’s lightering regulation will reduce annual VOC emissions by 1,115 tons. Thi i i l d d f TOTAL i l d i i h i i d i i i d
6
This quantity is excluded from TOTAL potential reductions since these emissions reductions are anticipated to result from existing Delaware regulation.
These estimates assume that lightering can be controlled on 100% of ships.
7
MANE VU 2002 M bil NO MANE VU 2002 Mobile NOx Emissions (tons)
MANE VU 2002 Mobile PM2.5 Emissions (tons)
182,588
Nonroad
22,107 17,332
nonroad diesel Other Mobile 378,873
Diesel Other Mobile
Mobile
8
9
10
11
12
13
14
State Annual freight (millions tons) 2006 Drayage Emissions (tpy) Annual Benefit 10% (tpy) Lifetime Benefit 24 years (tons) NY/NJ 157 1,935 190 4,555 CT 17 212 21 499 DE 11 137 13 324 MA 26 320 31 755 MD 41 508 50 1,197 ME 26 320 31 755 NH 4 50 5 117 NJ 45 553 54 1,302 NY 10 125 12 295 PA 103 1 263 124 2 976 PA 103 1,263 124 2,976 RI 9 114 11 268 VA 55 673 66 1,587 Total 504 6 210 610 14 629
15
Total 504 6,210 610 14,629
State Annual freight (millions tons) 2006 Drayage Emissions (tpy) Annual Benefit 9% (tpy) Lifetime Benefit 24 years (tons) NY/NJ 157 54 5.0 131 CT 17 6 0.5 13 DE 11 4 0.4 9 MA 26 9 0.8 20 MD 41 14 1.3 31 ME 26 9 0.8 20 NH 4 1 0.1 3 NJ 45 15 1.4 34 NY 10 3 0.3 8 PA 103 35 3.3 78 RI 9 3 0.3 7 VA 55 19 1.7 42 Total 504 173 16 0 396
16
Total 504 173 16.0 396
17
18