
SLIDE 1
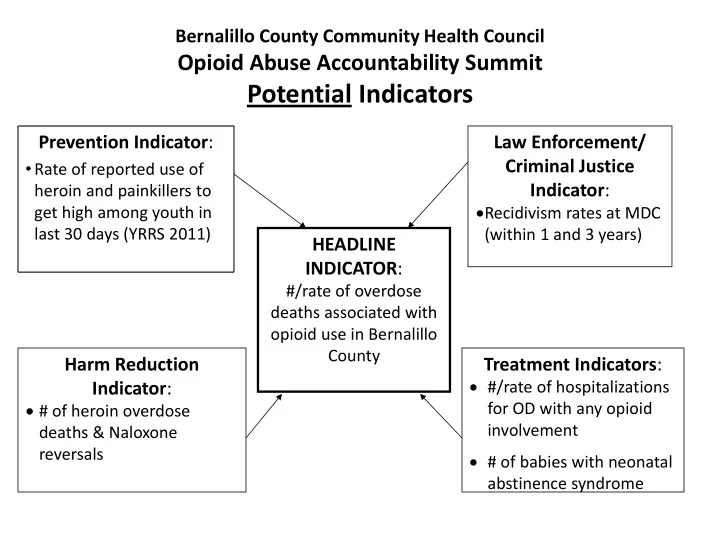
Bernalillo County Community Health Council
Opioid Abuse Accountability Summit
Potential Indicators
Prevention Indicator:
- Rate of reported use of
heroin and painkillers to get high among youth in last 30 days (YRRS 2011)
HEADLINE INDICATOR:
#/rate of overdose deaths associated with
- pioid use in Bernalillo