
SLIDE 1
Potential Economic Impacts if Environmental Services from - - PowerPoint PPT Presentation
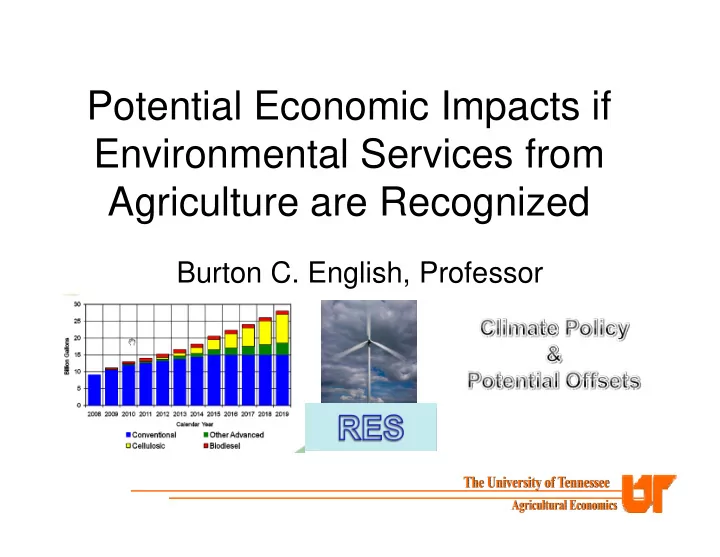
Potential Economic Impacts if Environmental Services from Agriculture are Recognized Burton C. English, Professor Burton C. English, Kim Jensen, Jamey Menard, and Burton C. English, Kim Jensen, Jamey Menard, and Daniel G. De La Torre Ugarte
Burton C. English, Kim Jensen, Jamey Menard, and Burton C. English, Kim Jensen, Jamey Menard, and Daniel G. De La Torre Ugarte Daniel G. De La Torre Ugarte
University of Tennessee, Agricultural Economics University of Tennessee, Agricultural Economics Bio Bio-
Based Energy Analysis Group October 23, 2009 October 23, 2009
– Impact of RES policy on farm revenue? – Potential of new markets for biomass and how much revenue could biomass sales generate at the farm level? – Direct employment opportunities that result from building
– Job growth on the farm supported by increased biomass production?
th Congress:
North Carolina Florida Colorado Kansas State RES 382.4 $ ‐ 127.9 $ ‐ 20% RES 760.7 $ 447.1 $ 208.4 $ 36.6 $ 25% RES 848.1 $ 447.1 $ 248.9 $ 36.6 $
North Carolina Florida Colorado Kansas NC RES 7,228 $ ‐ 8,995 $ ‐ 20% RES 14,376 $ 9,421 $ 10,517 $ 43,229 $ 25% RES 16,028 $ 9,419 $ 11,283 $ 43,229 $
By 2025, an estimated 7.2 to 11.3 billion kWh will be generated by renewables under an RES scenario . Statewide, the projected 2025 Total Industry Output (TIO) from operating additional renewable facilities is $1.9 billion under the Colorado RES, $3.0 billion under the 25% Federal RES, and just under $2.6 billion under the 20% Federal RES. Under the Colorado RES the largest economic impacts are projected to be derived from wind, followed by direct fire of wood residues and co-fire of wood residues with coal. Under the 25% RES and 20% RES’s, the largest impacts are projected to accrue from direct fire of wood residues, followed by wind and co-fire of wood residues with coal. Under the Colorado RES for 2025, the Denver BEA Region is projected to experience the largest economic gains, while under the 25% RES and 20% RES’s, the Grand Junction BEA Region is projected to receive the largest economic gains.
CO Res 20% RES Federal 25% RES Federal Impacts on Total Industry Output (Million $): Operating:
1,962.9 2,636.2 2,975.1
Household:
(217.9) (287.4) (322.2) As a Result of Agriculture:
Direct
127.9 208.4 127.9
Total
237.5 385.1 237.5
Investment
10,052.8 18,130.9 20,139.0 Number of Additional Jobs
Operating
11,102.0 19,311.0 21,091.0
Investment
64,810.0 115,410.0 127,965.0
Projected change in energy price
0.0042 0.0083 0.0096
2015 2025 Variable 25% RES 20% RES 25% RES 20% RES million dollars Total Industry Output: Operating
4,939.5 4,941.0 11,173.6 11,174.1
Household
(967.1) (1,042.5) (2,961.0) (2,806.0) Agriculture and Forestry:
Direct
204.1 204.1 447.1 447.1
Total
373.6 373.6 818.9 818.9
Investment Impactsb
16,660.7 16,662.8 5,277.4 5,277.4
Employment Impacts: Operating
19,025.0 19,027.0 42,800.0 42,802.0
Investment
103,444.0 103,457.0 29,724.0 29,724.0
Projected change in energy price (cents/kWh)
0.0044 0.0047 0.0115 0.0109
a Does not include cost impact on price of energy saving technologies b Investment impacts are one time impacts and for 2015 take place during the 2010-2015 time periodand for 2025 take place between the 2021-2025 time period
. In 2015, the projected requirements under the 25% RES are 11.9 billion kWh and and14.7 billion kWh for the 20% RES. For 2025, the projected requirements under the 25% RES are 48.6 billion kWh and under the 20% RES are 42.9 billion kWh. The projected net generation from renewable energy in the state is 11.52 billion kWh in 2015 and 24.79 in 2025 . Statewide, the projected 2025 Total Industry Output (TIO) from operating additional renewable facilities is $11.2 billion under the federal policy proposals . The Miami Region is projected to experience the greatest addition to economic activity, with the Orlando Region second, and the Sarasota Region third. The largest annual operating economic impacts are projected to be derived from gasification of metropolitan solid waste followed by direct fired dedicated energy crops. If developed, the annual impacts from dedicated energy crop production and collection of agricultural wastes for energy conversion are estimated at $819 million in
are projected receive the greatest agricultural impacts from development of the bioenergy sector.
6.6% 2.2% 38.4% 20.5% 1.5% 1.6% 22.1% 2.4% 4.8% Gainesville Jacksonville Miami Orlando Panama City Pensacola Sarasota Tallahassee Tampa
Total Industry Output from Investment
14.0% 0.7% 22.0% 30.8% 10.1% 9.9% 6.3% 0.0% 6.2% Gainesville Jacksonville Miami Orlando Panama City Pensacola Sarasota Tallahassee Tampa
Total Industry Output from Operating
Extensive wind energy projects are already planned in Kansas, The requirements for Kansas under either of the two federal energy proposals could be easily met with the planned wind energy. However, co-firing in existing coal- fired plants under 200MW is also considered as part of this study. The renewable energy produced with projections of wind and co-firing would exceed the requirements under either proposal, so the projected economic impacts are the same under either scenario. The Kansas agricultural sector averaged over $11 billion in receipts during 2000 to 2007. With $9.5 billion in expenses, the agricultural sectors realized net farm income has average slightly more than $1.5 billion over the same period. Eonomic activity from either RES could increase by $2.8 billion by 2015 or $53,537 per farm if the planned wind and potential co-fire projects are undertaken 20% RES 25% RES 20% RES 25% RES 2015 2025 Total I ndustry Output: Million Dollars Million Dollars Operating 5,164 5,164 5,164 5,164 Household b
Agriculture and Forestry: Wind Leases 20 20 20 20 Feedstocks 67 67 67 67 Investment Impactsc 30,377 30,377 30,377 30,377 Employment I mpacts: Jobs Jobs Operating 21,046.00 21,046.00 21,046 21,046 Investment 208,876.00 208,876.0 208,876 208,876 Dollars/kWh Dollars/kWh Projected change in energy price 0.0018 0.0024 0.0088 0.0076
NC Res 20% RES Federal 25% RES Federal Impacts on Total Industry Output (Million $): Operating: 2,663.8 4,913.8 5,425.0 Household: (421.1) (831.9) (957.8) Direct 382.4 451.2 848.1 Total 691.9 1,441.3 1,622.8 Investment 10,052.8 18,130.9 20,139.0 Number of Additional Jobs Operating 11,102.0 19,311.0 21,091.0 Investment 64,810.0 115,410.0 127,965.0 Projected change in energy price 0.0042 0.0083 0.0096
Statewide, the projected 2025 total industry impact total from operating is $2.7 billion under the current North Carolina RES, $5.4 billion under the 25% RES, and $4.9 billion under the 20% RES. Under each policy scenario, the Raleigh-Durham-Cary Region is projected to experience the greatest addition to economic activity, with the Greenville Region second, and the Greensboro- Winston-Salem-High Point Region third. The largest annual operating economic impacts are projected to be derived from direct fire of dedicated energy crops and wood wastes. This is followed by co-fire of wood and poultry wastes.
Jobs Resulting from the Additional Renewable Energy under the 20% RES Policy Scenario, North Carolina, 2025
Scenario Meet EISA Carbon Price Offsets Crop Residues Constrained Fertilizers Exempt
Yes None None Soil erosion Not Applicable
Regulated (EPA Led)
EISA+ High of 160 None Not applicable No
3 Multiple Offsets
EISA+ High of 27 1. Conservation Tillage 2. Bioenergy Crops 3. Afforestation 4. Grasslands 5. Methane capture Soil erosion Yes
Offsets / RCN
EISA+ High of 27 1. Conservation Tillage 2. Bioenergy Crops 3. Afforestation 4. Grasslands 5. Methane capture Soil carbon neutral Yes
Offsets
EISA+ High of 27 1. Conservation Tillage 2. Afforestation 3. Methane capture Soil erosion No
EISA = Energy Independence & Security Act Renewable Fuel Standard
Department of Agricultural Economics, Institute of Agriculture University of Tennessee http://www.agriculture.utk.edu/ Agricultural Policy Analysis Center http://agpolicy.org/
Bio-based Energy Analysis Group http://beag.ag.utk.edu/