Point Cloud Processing Has anyone seen the toothpaste? Given a - - PowerPoint PPT Presentation

point cloud processing
SMART_READER_LITE
LIVE PREVIEW

Point Cloud Processing Has anyone seen the toothpaste? Given a - - PowerPoint PPT Presentation

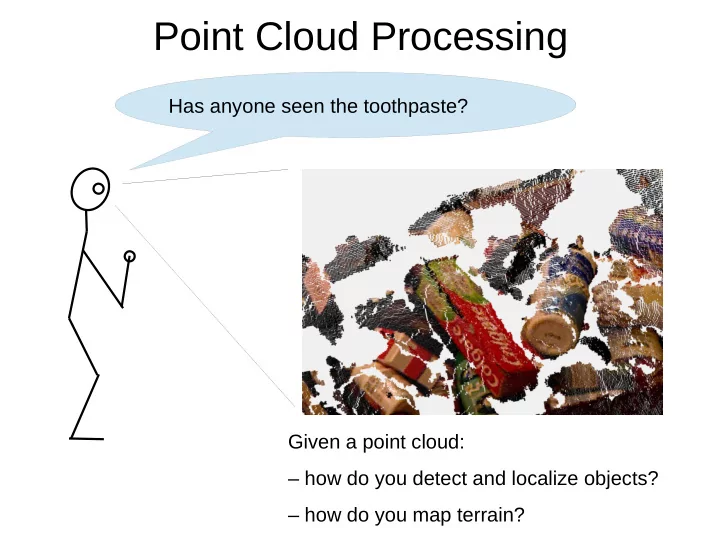
Point Cloud Processing Has anyone seen the toothpaste? Given a point cloud: how do you detect and localize objects? how do you map terrain? What is a point cloud? Point cloud: a set of points in 3-D space just a set of 3-d points


slide-1
SLIDE 1

Given a point cloud: – how do you detect and localize objects? – how do you map terrain?

Point Cloud Processing

Has anyone seen the toothpaste?

slide-2
SLIDE 2

What is a point cloud?

Point cloud: a set of points in 3-D space – just a set of 3-d points Mesh: each point is a vertex of a triangulated face – a set of vertices AND connectivity information Point cloud Mesh

Images from Course INF 555 slides, Ecole Polytechnique, Paris

slide-3
SLIDE 3

What is a point cloud?

Point cloud: a set of points in 3-D space – just a set of 3-d points Mesh: each point is a vertex of a triangulated face – a set of vertices AND connectivity information Point cloud Mesh But, a mesh contains a lot more information Many depth sensors produce point clouds natively

Images from Course INF 555 slides, Ecole Polytechnique, Paris

slide-4
SLIDE 4

Time of flight sensors

Hokuyo UTM-30LX-EW Scanning Laser Range Finder

slide-5
SLIDE 5

Time of flight sensors

Slide from Course INF 555 slides, Ecole Polytechnique, Paris

slide-6
SLIDE 6

Time of flight sensors

slide-7
SLIDE 7

Structured light sensors

slide-8
SLIDE 8

Slide: John MacCormick, Dickinson University

slide-9
SLIDE 9

Slide: John MacCormick, Dickinson University

slide-10
SLIDE 10

Slide: John MacCormick, Dickinson University

slide-11
SLIDE 11

Slide: John MacCormick, Dickinson University

slide-12
SLIDE 12

Slide: John MacCormick, Dickinson University

slide-13
SLIDE 13

Slide: John MacCormick, Dickinson University

slide-14
SLIDE 14

Calculating surface normals

Point cloud Point cloud w/ surface normals (normals are subsampled)

slide-15
SLIDE 15

Calculating surface normals

Question: How do we calculate the surface normal given only points? Answer:

  • 1. Calculate the sample covariance matrix of the points within

a local neighborhood of the surface normal

  • 2. Take Eigenvalues/Eigenvectors of that covariance matrix
slide-16
SLIDE 16

Calculating surface normals

Let denote the r-ball about x Suppose we want to calculate the surface normal at is the set of points in the cloud within r of x Let C denote the set of points in the point cloud

slide-17
SLIDE 17

Calculating surface normals

Calculate the sample covariance matrix of the points in

slide-18
SLIDE 18

Calculating surface normals

Eigenvalues of Length = Principle axes of ellipse point in directions of corresponding eigenvectors Length =

slide-19
SLIDE 19

Calculating surface normals

So: surface normal is in the direction of the Eigenvector corresponding to the smallest Eigenvalue of

slide-20
SLIDE 20

Calculating surface normals: Summary

  • 1. calculate points within r-ball about x:
  • 2. calculate covariance matrix:
  • 3. calculate Eigenvectors:

and Eigenvalues: (\lambda_3 is smallest)

  • 4. v_3 is parallel or antiparallel to surface normal
slide-21
SLIDE 21

Calculating surface normals

Important note: the points alone do not tell us the sign

  • f the surface normal
slide-22
SLIDE 22

Calculating surface normals

Important note: the points alone do not tell us the sign

  • f the surface normal
slide-23
SLIDE 23

Calculating surface normals

How large a point neighborhood to use when calculating ? Because points can be uneven, don't use k-nearest neighbor. – it's important to select a radius r and stick w/ it. – which what value of r to use?

slide-24
SLIDE 24

Calculating surface normals

Images from Course INF 555 slides, Ecole Polytechnique, Paris

slide-25
SLIDE 25

Calculating surface normals

Images from Course INF 555 slides, Ecole Polytechnique, Paris

slide-26
SLIDE 26

Outlier removal

Similar approach as in normal estimation:

  • 1. calculate local covariance matrix
  • 2. estimate Eigenvectors/Eigenvalues
  • 3. use that information somehow...

Images from Course INF 555 slides, Ecole Polytechnique, Paris

slide-27
SLIDE 27

Outlier removal

If points lie on a line, then is small If points are uniformly random, then is close to 1 Outlier removal: delete all points for which is above a threshold

Images from Course INF 555 slides, Ecole Polytechnique, Paris

slide-28
SLIDE 28

Point cloud registration: ICP

Images from Course INF 555 slides, Ecole Polytechnique, Paris

Find an affine transformation that aligns two partially overlapping point clouds

slide-29
SLIDE 29

ICP Problem Statement

This slide from: Burgard, Stachniss, Bennewitz, Arras, U. Freiburg

slide-30
SLIDE 30

ICP: key idea

This slide from: Burgard, Stachniss, Bennewitz, Arras, U. Freiburg

slide-31
SLIDE 31

Step 1: center the two point clouds

This slide from: Burgard, Stachniss, Bennewitz, Arras, U. Freiburg

slide-32
SLIDE 32

Step 2: use SVD to get min t and R

This slide from: Burgard, Stachniss, Bennewitz, Arras, U. Freiburg

slide-33
SLIDE 33

Step 2: use SVD to get min t and R

This slide from: Burgard, Stachniss, Bennewitz, Arras, U. Freiburg

slide-34
SLIDE 34

ICP data association problem

This slide from: Burgard, Stachniss, Bennewitz, Arras, U. Freiburg

slide-35
SLIDE 35

ICP Algorithm

Input: two point sets, X and P Output: translation t and rotation R that best aligns pt sets

  • 1. Start with a “good” alignment
  • 2. Repeat until t and R are small:
  • 3. for every point in X, find its closest neighbor in P
  • 4. find min t and R for that correspondence assignment
  • 5. translate and rotate P by t and R
  • 6. Figure out net translation and rotation, t and R

– Converges if the point sets are initially well aligned – Besl and McKay, 1992

slide-36
SLIDE 36

ICP example

This slide from: Burgard, Stachniss, Bennewitz, Arras, U. Freiburg

slide-37
SLIDE 37

ICP Variants

This slide from: Burgard, Stachniss, Bennewitz, Arras, U. Freiburg

slide-38
SLIDE 38

Selecting points to align

This slide from: Burgard, Stachniss, Bennewitz, Arras, U. Freiburg

slide-39
SLIDE 39

Normal-space sampling

This slide from: Burgard, Stachniss, Bennewitz, Arras, U. Freiburg

slide-40
SLIDE 40

Comparison: normal space sampling vs random

This slide from: Burgard, Stachniss, Bennewitz, Arras, U. Freiburg

slide-41
SLIDE 41

Feature based sampling

This slide from: Burgard, Stachniss, Bennewitz, Arras, U. Freiburg

slide-42
SLIDE 42

ICP: data association

This slide from: Burgard, Stachniss, Bennewitz, Arras, U. Freiburg

slide-43
SLIDE 43

ICP: data association

This slide from: Burgard, Stachniss, Bennewitz, Arras, U. Freiburg

slide-44
SLIDE 44

Closest point matching

This slide from: Burgard, Stachniss, Bennewitz, Arras, U. Freiburg

slide-45
SLIDE 45

Normal shooting

This slide from: Burgard, Stachniss, Bennewitz, Arras, U. Freiburg

slide-46
SLIDE 46

Point-to-plane distances

This slide from: Burgard, Stachniss, Bennewitz, Arras, U. Freiburg

slide-47
SLIDE 47

Closest compatible point

This slide from: Burgard, Stachniss, Bennewitz, Arras, U. Freiburg

slide-48
SLIDE 48

ICP: summary

This slide from: Burgard, Stachniss, Bennewitz, Arras, U. Freiburg

slide-49
SLIDE 49

Another approach to alignment: RANSAC

This slide from: Kavita Bala, Cornell U.

slide-50
SLIDE 50

RANSAC

This slide from: Kavita Bala, Cornell U.

slide-51
SLIDE 51

How does regression work here?

slide-52
SLIDE 52

Image alignment problem

This slide from: Kavita Bala, Cornell U.

slide-53
SLIDE 53

Outliers

This slide from: Kavita Bala, Cornell U.

slide-54
SLIDE 54

RANSAC

This slide from: Kavita Bala, Cornell U.

slide-55
SLIDE 55

RANSAC key idea

This slide from: Kavita Bala, Cornell U.

slide-56
SLIDE 56

Counting inliers

This slide from: Kavita Bala, Cornell U.

slide-57
SLIDE 57

Counting inliers

This slide from: Kavita Bala, Cornell U.

slide-58
SLIDE 58

How do we find the best line?

This slide from: Kavita Bala, Cornell U.

slide-59
SLIDE 59

RANSAC

This slide from: Kavita Bala, Cornell U.

slide-60
SLIDE 60

This slide from: Kavita Bala, Cornell U.

slide-61
SLIDE 61

This slide from: Kavita Bala, Cornell U.

slide-62
SLIDE 62

This slide from: Kavita Bala, Cornell U.

slide-63
SLIDE 63

Using RANSAC to Fit a Sphere

slide-64
SLIDE 64

Using RANSAC to Fit a Sphere

slide-65
SLIDE 65

Using RANSAC to Fit a Sphere

Center? Radius?

slide-66
SLIDE 66

Using RANSAC to Fit a Sphere

How generate candidate spheres? How score spheres?

slide-67
SLIDE 67

Using RANSAC to Fit a Sphere

How generate candidate spheres?

  • 1. sample a point

How score spheres?

slide-68
SLIDE 68

Using RANSAC to Fit a Sphere

How generate candidate spheres?

  • 1. sample a point
  • 2. estimate surface normal

How score spheres?

slide-69
SLIDE 69

Using RANSAC to Fit a Sphere

How generate candidate spheres?

  • 1. sample a point
  • 2. estimate surface normal
  • 3. sample radius

radius How score spheres?

slide-70
SLIDE 70

Using RANSAC to Fit a Sphere

How generate candidate spheres?

  • 1. sample a point
  • 2. estimate surface normal
  • 3. sample radius
  • 4. estimate center to be radius distance

from sampled point along surface normal radius How score spheres?

slide-71
SLIDE 71

Using RANSAC to Fit a Sphere

How generate candidate spheres?

  • 1. sample a point
  • 2. estimate surface normal
  • 3. sample radius
  • 4. estimate center to be radius distance

from sampled point along surface normal radius How score spheres?

  • 1. count num pts within epsilon of

candidate sphere surface

slide-72
SLIDE 72

Using RANSAC to Fit a Cylinder

How generate candidate cylinders?

slide-73
SLIDE 73

Using RANSAC to Fit a Cylinder

How generate candidate cylinders?

  • 1. sample two pts
slide-74
SLIDE 74

Using RANSAC to Fit a Cylinder

How generate candidate cylinders?

  • 1. sample two pts
  • 2. estimate surface normal at both pts
slide-75
SLIDE 75

Using RANSAC to Fit a Cylinder

How generate candidate cylinders?

  • 1. sample two pts
  • 2. estimate surface normal at both pts
  • 3. get sample axis by taking cross product

between two normals

slide-76
SLIDE 76

Using RANSAC to Fit a Cylinder

How generate candidate cylinders?

  • 1. sample two pts
  • 2. estimate surface normal at both pts
  • 3. get sample axis by taking cross product

between two normals

  • 4. project points onto plane orthogonal to axis
  • 5. fit a circle using a method similar to what we

did for the sphere.

slide-77
SLIDE 77

Using RANSAC to Fit a Cylinder

How generate candidate cylinders?

  • 1. sample two pts
  • 2. estimate surface normal at both pts
  • 3. get sample axis by taking cross product

between two normals

  • 4. project points onto plane orthogonal to axis
  • 5. fit a circle using a method similar to what we

did for the sphere. 3x1 unit vector in direction of axis 3xn matrix of pts in 3d space 3xn matrix of pts projected onto plane

slide-78
SLIDE 78

RANSAC: the parameters

This slide from: Kavita Bala, Cornell U.

slide-79
SLIDE 79

RANSAC: how many rounds?

This slide from: Kavita Bala, Cornell U.

slide-80
SLIDE 80

RANSAC: how many parameters to sample?

This slide from: Kavita Bala, Cornell U.

slide-81
SLIDE 81

RANSAC Summary

This slide from: Kavita Bala, Cornell U.

slide-82
SLIDE 82

Hough transform

This slide from: Kavita Bala, Cornell U.

slide-83
SLIDE 83

Hough transform

This slide from: Kavita Bala, Cornell U.

slide-84
SLIDE 84

Hough transform

This slide from: Kavita Bala, Cornell U.

slide-85
SLIDE 85

Hough transform

This slide from: Kavita Bala, Cornell U.

slide-86
SLIDE 86

Hough transorm

This slide from: Kavita Bala, Cornell U.