Plot your teams four seismic spectra on one graph. Enter your teams - - PowerPoint PPT Presentation

plot your team s four seismic spectra on one graph enter
SMART_READER_LITE
LIVE PREVIEW

Plot your teams four seismic spectra on one graph. Enter your teams - - PowerPoint PPT Presentation

January 22, 2018 presentation 1/22: Round 1 data capture & seismic spectra , Resonance https://youtu.be/7_aCYVxQsJA 1/23 & 24: Resonance continued Using Resonance Model 1/25: Earthquake-resistant Structures - class discussion, then prepare


slide-1
SLIDE 1

January 22, 2018 presentation

1/22: Round 1 data capture & seismic spectra, Resonance

https://youtu.be/7_aCYVxQsJA

1/23 & 24: Resonance continued Using Resonance Model 1/25: Earthquake-resistant Structures - class discussion, then prepare for Test and Assignments due 1/26 1/26: MAJOR Grade Test: (Multiple-Choice, Open Book, Work Individually) on Resonance and Earthquake-resistant Structures. Resources on

RedPanda website: https://goo.gl/UJ2LRX

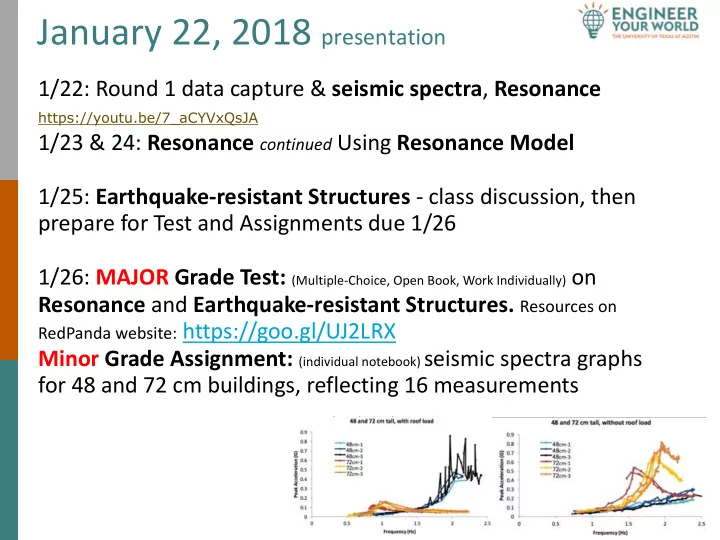
Minor Grade Assignment: (individual notebook) seismic spectra graphs for 48 and 72 cm buildings, reflecting 16 measurements

slide-2
SLIDE 2

Plot your team’s four seismic spectra on one graph.

slide-3
SLIDE 3

Enter your team’s seismic spectra on shared data table.

https://goo.gl/Suo6vB

https://docs.google.com/spreadsheets/d/1-MwD0i6XFiQCQJAqavTSDcNsYMeqrjebkzvnPC-d4JE/edit?usp=sharing
slide-4
SLIDE 4

Combine seismic spectra for all teams.

slide-5
SLIDE 5

Why Did We Test the Buildings?

qTesting takes time and resources. qWhy not just design new buildings right

away?

slide-6
SLIDE 6

Because…

1.Customers explicitly asked for evidence of

building safety.

2.Testing provides baseline data against which

you can compare other designs. How else would you determine if a new design is better? Could be worse!

3.Testing taught valuable lessons such as

resonance, which is critical quake-resistance structures.

slide-7
SLIDE 7

What do the data reveal? How safe is each of these buildings? The high acceleration “humps” on the graph suggest safety problems. Answer: There is resonance near the frequency of the “hump”. Resonance is the tendency of a system to oscillate with greater amplitude at certain frequencies. Structures behave unpredictably around their resonant frequencies, so we want to avoid those! So: We need to do quantify the safety of the buildings by analyzing

  • ur test data resonance.
slide-8
SLIDE 8

We are concerned about acceleration and displacement.

High displacement à high forces on the building, especially at the base. High acceleration à high forces on the building, and on people and objects inside.

slide-9
SLIDE 9

Resonance

q A building with a high center of mass shaking back

and forth is like a tall stick with a mass on the end shaking back and forth. See resonance demo:

M

This beam is anchored only on one end – in this case, the bottom. A structure like this is called a cantilever, with a mass load on top.

=

https:// youtu.b e/7_aCY VxQsJA

slide-10
SLIDE 10

Before we can design a new building, we must understand resonance.

Tacoma Narrows Bridge:

https://www.youtube.com/watch?v=qbOjxPCfaFk

Engineering simulation:

https://www.youtube.com/watch?v=OrqdFxpM_N4

slide-11
SLIDE 11

A Model for Resonance

! ∝ # $%&

As stiffness (k) increases, the resonant frequency (f) increases, non-linearly. As height (H) increases, (f) decreases, non-linearly. As mass (M) increases, (f) decreases, non-linearly.

slide-12
SLIDE 12
slide-13
SLIDE 13
slide-14
SLIDE 14

So in terms of our testing of model buildings: The higher the frequency at which the earth shakes, the greater the energy intensity the earthquake produces and thus the greater the force the shaking ground exerts on the buildings. We can use the equation above to predict how much a certain Force will displace x (move away from vertical) a building if we know the stiffness k of that building. So, to minimize the displacement x of a building when it is shaken by an earthquake Force, the building should have as high a stiffness k as practical.

x = Force/ k

slide-15
SLIDE 15
slide-16
SLIDE 16
slide-17
SLIDE 17

Thus, the resonant frequency decreases to about 0.7 x of the original when the mass is doubled (2X).

slide-18
SLIDE 18
slide-19
SLIDE 19
slide-20
SLIDE 20
slide-21
SLIDE 21
slide-22
SLIDE 22