
SLIDE 1
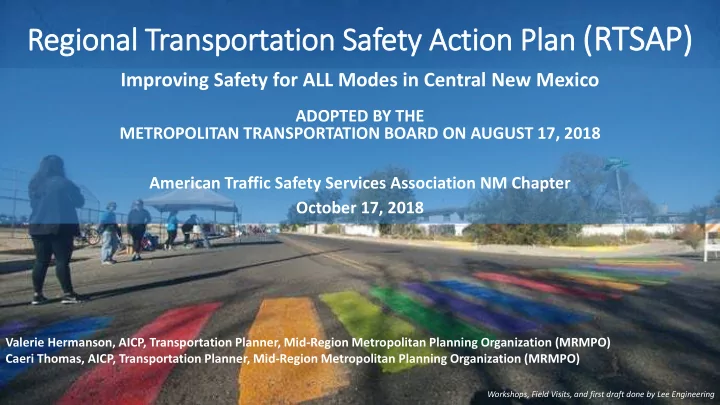
Regional Transport rtation Safety Ac Action Pl Plan (RTSAP)
TSAP)
Improving Safety for ALL Modes in Central New Mexico
ADOPTED BY THE METROPOLITAN TRANSPORTATION BOARD ON AUGUST 17, 2018 American Traffic Safety Services Association NM Chapter October 17, 2018
Workshops, Field Visits, and first draft done by Lee Engineering
Valerie Hermanson, AICP, Transportation Planner, Mid-Region Metropolitan Planning Organization (MRMPO) Caeri Thomas, AICP, Transportation Planner, Mid-Region Metropolitan Planning Organization (MRMPO)