
SLIDE 1
Cécile Renault
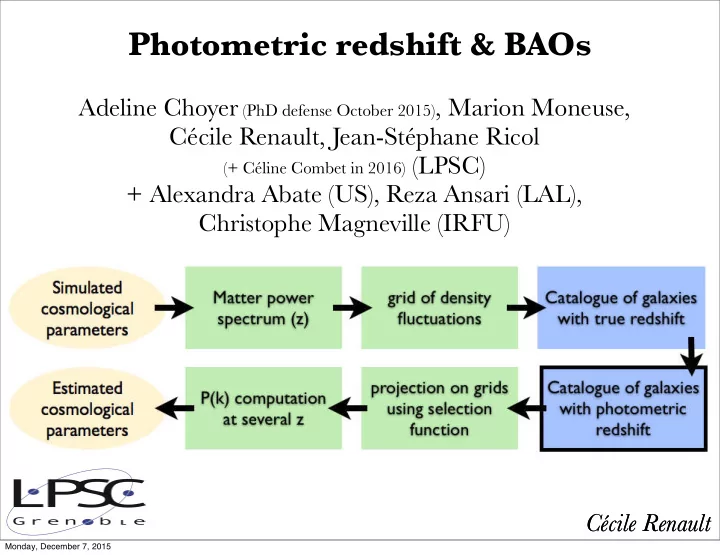
Photometric redshift & BAOs
Adeline Choyer (PhD defense October 2015), Marion Moneuse, Cécile Renault, Jean-Stéphane Ricol
(+ Céline Combet in 2016) (LPSC)
+ Alexandra Abate (US), Reza Ansari (LAL), Christophe Magneville (IRFU) Cécile Renault
Monday, December 7, 2015