Clustering-based redshift estimation with LSST & DESI Mubdi - - PowerPoint PPT Presentation

clustering based redshift estimation with lsst desi
SMART_READER_LITE
LIVE PREVIEW

Clustering-based redshift estimation with LSST & DESI Mubdi - - PowerPoint PPT Presentation

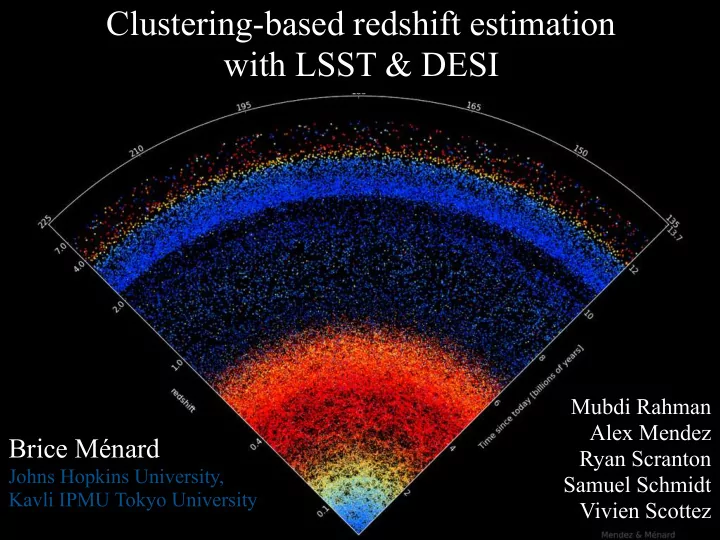
Clustering-based redshift estimation with LSST & DESI Mubdi Rahman Alex Mendez Brice Mnard Ryan Scranton Johns Hopkins University, Samuel Schmidt Kavli IPMU Tokyo University Vivien Scottez What is a photometric redshift? Photometric


slide-1
SLIDE 1

Brice Ménard

Johns Hopkins University, Kavli IPMU Tokyo University

Clustering-based redshift estimation with LSST & DESI

Mubdi Rahman Alex Mendez Ryan Scranton Samuel Schmidt Vivien Scottez

slide-2
SLIDE 2

What is a photometric redshift?

Photometric redshift estimation is a mapping from the photometric space {Fi} to redshift.

redshift space


Dim = 1

Photometric space

Dim ~ 10

f

brightness ra,dec size ellipticity … N~4 colors

slide-3
SLIDE 3

What is a photometric redshift?

Photometric redshift estimation is a mapping from the photometric space {Fi} to redshift. p(z | {Fi} ) does not apply to a given object but to a class of objects statistically indistinguishable. Color-based photometric redshifts are the same for all galaxies with similar colors (set by photometric errors). Any measured property in {Fi} has an associated noise estimate. A photometric source is not just a point in {Fi} but a region defined by the noise level.

slide-4
SLIDE 4

redshift space


Dim = 1

Photometric space

Dim ~ 10

f

brightness ra,dec size ellipticity … N~4 colors

What is a photometric redshift?

slide-5
SLIDE 5

redshift space


Dim = 1

Mapping the photometric space to redshift space

Photometric space

Dim ~ 10

brightness ra,dec size ellipticity … N~4 colors

Photometric Redshifts

SEDs or Training Sets

f

ˆ

Hildebrandt et al.

slide-6
SLIDE 6

redshift space


Dim = 1

Mapping the photometric space to redshift space

Photometric space

Dim ~ 10

brightness ra,dec size ellipticity … N~4 colors

Photometric Redshifts

SEDs or Training Sets

f

ˆ

slide-7
SLIDE 7

redshift space


Dim = 1

Mapping the photometric space to redshift space

Clustering Redshifts

Spatial Correlation with Reference Set

f

ˆ

Photometric space

Dim ~ 10

brightness ra,dec size ellipticity … N~4 colors

Photometric Redshifts

SEDs or Training Sets

f

ˆ

< ∂ . ∂ref(ra,dec) > < color . Fref(λ) >

Schneider et al. (2006)
 Ho et al. (2008)
 Newman (2008, 2010)
 Ménard et al. (2013)
 Schmidt et al. (2013)
 McQuinn & White (2013)

slide-8
SLIDE 8

< ∂i . ∂unknown >

?

slide-9
SLIDE 9

< ∂i . ∂unknown >

?

slide-10
SLIDE 10

redshift space


Dim = 1

Photometric space

Dim ~ 10

Photometric Redshifts

SEDs or Training Sets

f

ˆ

brightness ra,dec size ellipticity … N~4 colors

< color . Fref(λ) >

Clustering Redshifts

Spatial Correlation with Reference Set

f

ˆ

< ∂ . ∂ref(ra,dec) > Mapping the photometric space to redshift space ~ b(z) x dN/dz

slide-11
SLIDE 11

SDSS

  • ptical

2MASS near infrared WISE infrared CFHT-LS

  • ptical

Applications of clustering redshifts

slide-12
SLIDE 12

SDSS

  • ptical

2MASS near infrared WISE infrared CFHT-LS

  • ptical

Applications of clustering redshifts

~100 million galaxies at

spectroscopic galaxy sample r < 18 mag 1 million objects

x ∆z

slide-13
SLIDE 13

sample 1: 0.5 < g-r < 0.6 sample 2: 1.3 < g-i < 1.4 sample 3: 1.2 < g-r < 1.3 ~ 6,300 galaxies ~ 10,000 galaxies ~ 2,500 galaxies

= 1

Photometrically-selected galaxies

Rahman et al. (2015)

slide-14
SLIDE 14

Rahman, BM et al. (2015)

= 1

Generalization to one million galaxies

slide-15
SLIDE 15

15

Rahman, BM et al. (2015)

Generalization to one million galaxies

slide-16
SLIDE 16

Comparison to photometric redshifts

SDSS KD-tree photometric redshifts

sample 2 sample 3

Rahman, BM et al. (2015)

slide-17
SLIDE 17

SDSS

  • ptical

2MASS near infrared WISE infrared CFHT-LS

  • ptical

Applications of clustering redshifts

~100 million galaxies at

x ∆z

Entire photometric sample r < 22 mag 100 million objects

slide-18
SLIDE 18

information used: (u,g,r,i,z) + (ra,dec) u-g g-r r-i i-z color color color color What can I do with 100 million photometric galaxies? color color color color

slide-19
SLIDE 19

Rahman, Mendez, BM et al. (2015)

arXiv:1512.03057

slide-20
SLIDE 20

Rahman, Mendez, BM et al. (2015)

arXiv:1512.03057

slide-21
SLIDE 21
slide-22
SLIDE 22

Comparison clustering-z vs photo-z

Rahman et al. (2015)

slide-23
SLIDE 23

2MASS near infrared SDSS

  • ptical

WISE infrared CFHT-LS

  • ptical

Applications of clustering redshifts 2MASS extended sources K < 14 mag 1.5 million objects J H K

λ [µm]

1.0 1.5 2.0 2.5

slide-24
SLIDE 24

Observations: 1997-2001, J, H & K bands

Skrutskie et al. (2006)

mean cluster-z

Rahman et al. (2015)

slide-25
SLIDE 25

2MASS near infrared SDSS

  • ptical

WISE infrared CFHT-LS

  • ptical

Applications of clustering redshifts 2MASS extended sources K < 14 mag 1.5 million objects 2MASS extended sources point sources K < 14 mag 1.5 million objects J H K

λ [µm]

1.0 1.5 2.0 2.5

slide-26
SLIDE 26

clustering redshifts for extended & point sources

Rahman et al. (2015)

slide-27
SLIDE 27

Difficult sources for photometric redshifts

interlopers from ≠ z galaxy/AGN mergers strongly lensed galaxies emission-line driven sources dust-reddened

  • bjects

log N

~300,000

slide-28
SLIDE 28

Clustering redshifts

We have a new tool in hand to characterize the mapping between the photometric space and redshift

redshift Photometric space Photo-z

Cluster-z

summary

color color color color cluster-z

We can already deproject various photometric datasets and obtain meaningful color-redshift tracks.