SLIDE 2 A short history of the Kamioka program Neutrino oscillation physics & T2K Hyper-K and the Korean detector
2017/06/21
SLIDE 3 Late 70’s: Grand Unified Theories are very popular
- Started with 𝑇𝑉(5) & 𝑇𝑃 10 [1974]
- Predict `Leptoquark` operators that conserve 𝐶 − 𝑀, but not 𝐶
Predicted lifetime of the proton 1030 ~ 1035 years. 18g H2O = 10𝑂
𝐵 = 6 × 1024 protons
Therefore a few kilotonnes (gigagram) of material would be enough to start testing the theories… Early 80’s: Experiments designed and built to test these predictions 𝑣 + 𝑣 → ത d + e+ gives rise to 𝒒 → 𝝆𝟏 + 𝒇+
“Proton decay”
SLIDE 4 A few tonnes is still a lot of material to instrument. Practically you need:
- Something cheap and easy to maintain.
- That your source is also the detector
- Surface instrumentation (𝑀2 instead of 𝑀3)
Suitable technology: Water-Cherenkov Conical radiation pattern intersects surface to make a ring
- Direction from centre of ring
- Energy from range (thickness
- f ring)
- Works nicely for low mass
particles. Water is cheap, and (if purified) can be very transparent.
cos𝜄 = 1 𝑜𝛾 𝑜 ≃ 1.4 ∴ 𝜄𝛾=1 ∼ 43°
SLIDE 5 1982 ~ 1983: The “Kamioka Nucleon Decay Experiment” was constructed in Mozumi mine near Kamioka town in central Japan to look for proton decay. 𝑞 → 𝜌0 + 𝒇+ 𝑞 → ↪ 𝜹 + 𝜹 Cherenkov light collected by 1k specially-designed 20" PMTs.
- Large PMTs meant more of the tank
surface was sensitive to photons.
- More photocoverage means better
energy resolution.
16.0m 15.6m
SLIDE 6 1985: The Kamiokande detector was upgraded to enable it to see solar
- neutrinos. Now also “Kamioka Neutrino Detection Experiment”
1987: Neutrinos are detected from SN1987A in the LMC.
- (First) Nobel Prize for Kamioka neutrino program in 2012.
- Supernova close enough so see with neutrinos are expected ~30
years… <hint> <hint>
- Needed low threshold (few MeV).
- Outer detector (OD) added to veto
entering particles.
- The water is highly purified and recycled
to remove Radon (low-energy B/G.) This work paid off spectacularly (& luckily):
SLIDE 7 1990’s: ‘Oscillation’ phenomenon suspected to be explanation of deficit seen in both solar neutrinos and atmospheric neutrinos.
- A larger experiment could investigate ‘shape’ predictions of
- scillation mechanism with much better statistics.
- Improvements to purification meant water is usefully transparent
for longer distances. Build Super-Kamiokande!
- Also incorporate things learnt
(e.g. better OD) and upgrade readout technology
39.3m 41.4m
SLIDE 8 By 2000, experiments with atmospheric neutrinos were showing some limitations:
- Neutrino flux estimates rely on detailed simulation of the hadronic
cascades, over several orders of magnitude in energy.
- Small errors in reconstructing the neutrino direction
result in big changes in guessing the origin point. Neutrinos from accelerators are much better! Even if you don’t understand the source fully:
- You know where it is.
- You can measure it.
K2K was the first experiment to try this approach to measuring
- scillations, is its (currently running) successor.
The question is, where do we go next?
SLIDE 9 A short history of the Kamioka program Neutrino oscillation physics & T2K Hyper-K and the Korean detector
2017/06/21
SLIDE 10 Neutrinos are ‘born’ in weak processes.
- They are defined by the associated charge lepton.
Also detected by weak interactions well defined flavour state. So the oscillation probability is: 𝑄 ν𝛽 → ν𝛾 = 𝜉𝛾 𝑈𝑗𝑛𝑓 𝑞𝑏𝑡𝑡𝑓𝑡 𝜉𝛽
2
The passage of (space-)time is through the usual operator: 𝑓−i
𝐹𝑢−ෝ 𝒒∙𝒚
In vacuum the eigenstates of this operator are mass eigenstates 𝑛𝑗 Therefore transform flavour into mass states and back:
𝑄 ν𝛽 → ν𝛾 = 𝜉𝛾 𝑉𝛾𝑗
† 𝑓−i 𝐹𝑗𝑢−𝒒𝒋∙𝒚 𝑉𝛽𝑗 † 𝜉𝛽 2 𝑋 ℓ 𝜉ℓ
SLIDE 11 𝑄 ν𝛽 → ν𝛾 = 𝜉𝛾 𝑉𝛾𝑗
† 𝑓−i 𝐹𝑗𝑢−𝒒𝒋∙𝒚 𝑉𝛽𝑗 † 𝜉𝛽 2
The phase evolution can be expanded in two parts: 1. Global phase advance that disappears in the modulus 2. Relative phase between the different 𝜉𝑗. For ultra-relativistic neutrinos this is: 𝑛𝑗
2 − 𝑛𝑘 2 𝑀
4𝐹 = Δ𝑛𝑗𝑘
2 𝑀
4𝐹
0% 100% 100% 0% 50% 50%
SLIDE 12 𝑄 ν𝛽 → ν𝛾 = 𝜉𝛾 𝑉𝛾𝑗
† 𝑓−i 𝐹𝑗𝑢−𝒒𝒋∙𝒚 𝑉𝛽𝑗 † 𝜉𝛽 2
The phase evolution can be expanded in two parts: 1. Global phase advance that disappears in the modulus 2. Relative phase between the different 𝜉𝑗. For ultra-relativistic neutrinos this is: 𝑛𝑘
2 − 𝑛𝑗 2 𝑀
4𝐹 = Δ𝑛𝑘𝑗
2𝑀
4𝐹
0% 100% 100% 0% 50% 50%
Upshot: Oscillations occur based on 2 independent mass2 splittings, provided the propagation distance satisfies 𝛦𝑛𝑘𝑗
2𝑀 > 4𝐹.
For 3 generations, the most general mixing matrix is complex and has 4 real parameters.
SLIDE 13 With 3 generations and non-zero mass, CKM- style mixing is natural: 𝜉𝑓 𝜉𝜈 𝜉𝜐 = 𝑉𝑓1 𝑉𝑓2 𝑽𝒇𝟒 𝑉𝜈1 𝑉𝜈2 𝑉𝜈3 𝑉𝜐1 𝑉𝜐2 𝑉𝜐3 𝜉1 𝜉2 𝜉3 More surprising: 8 elements are large
- 𝑽𝒇𝟒 is significant as the smallest
element, and the last to be measured (or inferred). Important to note: KM-mechanism CPv requires that all elements are non-zero
1
ൗ 1 2 ൗ 2 3 ൗ 1 3 ൗ 1 6
𝜉𝑓 𝜉𝜈 𝜉𝜐
SLIDE 14 𝜉𝑓 𝜉𝜈 𝜉𝜐
Sign of Δ𝑛⊙
2 is known is known from solar
experiments
SLIDE 15
The mixing matrix is commonly parameterised as the product of two rotations and a unitary transformation. Writing s𝑗𝑘 = sin𝜄𝑗𝑘, and c𝑗𝑘 = cos𝜄𝑗𝑘: c12 s12 −s12 c12 1 c13 s13ei𝜀 1 −s13e−i𝜀 c13 1 c23 s23 −s23 c23 This choice is convenient as the original solar and atmospheric disappearance signals could be approximated as functions of 𝜾𝟐𝟑 and 𝜾𝟑𝟒, respectively. Essentially this was a careful (lucky?) choice of variables S.T. the third angle 𝜾𝟐𝟒 describes the magnitude of the smallest element: 𝑉𝑓3 = sin 𝜄13 𝑓−𝑗𝜀
SLIDE 16 𝜉𝜈 → 𝜉𝑓
The ν𝑓 appearance probability can be written approximately as a sum of terms quadratic in the small parameters 𝛽 = Τ ∆𝑛21
2
∆𝑛31
2 ≈
Τ ±1 32, and sin 2𝜄13: where 𝑈𝜄𝜄 = sin2𝜄23, 𝑈
𝛽𝛽 = cos2 𝜄23 sin22𝜄12,
𝑈𝛽𝜄 = cos 𝜄13 sin 2𝜄12 sin 2𝜄23 and ∆= ∆𝑛31
2 𝑀
4𝐹
~ 2𝑜−1 𝜌
2
at 1st osc. max.
𝑄 ν𝜈 → ν𝑓 ≈ 𝑈𝜄𝜄sin22𝜄13
sin2 1−𝐵 ∆ 1−𝐵 2
+ 𝑈
𝛽𝛽𝛽2 sin2 𝐵∆ 𝐵2
+ 𝑈𝛽𝜄𝛽 sin 2𝜄13
sin 1−𝐵 ∆ 1−𝐵 sin 𝐵∆ 𝐵
cos 𝜀 + ∆
𝐵 =
ൗ 2 2𝐻𝐺𝑜𝑓𝐹 ∆𝑛31
2
is the matter density parameter. Here, 𝐵 ≃ 𝐹/10GeV
SLIDE 17 Uses the existing Super-K detector and J-PARC high-power proton facility
- n the east cost of Japan.
- Near detector suite “ND280” characterises neutrino beam
Main ring Primary beamline Decay volume Neutrinos
SLIDE 18 T2K is the first experiment to have its detectors off-axis Relativistic kinematics at a small angle to the beam axis, neutrino energy is insensitive to parent pion energy. Gives slightly narrower flux peak, and drastically reduces high energy tail.
- Ideal for νe appearance (much reduced NC BG)
3.0°2.5° 2.0°
0.5 1 1.5 2 2.5 3 3.5 4 Neutrino energy /GeV Neutrino flux /arb.unit
T2K On-axis Off-axis 2.0o Off-axis 2.5o Off-axis 3.0o
SLIDE 19 The oscillation probability is measured as a function of energy, and typically has peaks spaced at 1
𝐹 , with a tail down to no oscillation at high
energies.
1st 2nd
3rd
4th
Flux peak
SLIDE 20 𝐔𝟑𝐋
For Δ~ 𝜌
2, we know the magnitude of the second term is small (~10−3) so
any signal above that is evidence that sin22𝜄13 > 0, regardless of the value of the other unknowns. It turned out that 𝑸 𝝃𝝂 → 𝝃𝒇 ~ 𝟏. 𝟐, slightly above previous limit.
- Easy to see, requiring <10% of T2K design sensitivity.
- Also means we can essentially ignore the second term.
𝑄 ν𝜈 → ν𝑓 ≈ 𝑈𝜄𝜄sin22𝜄13
sin2 1−𝐵 ∆ 1−𝐵 2
+ 𝑈
𝛽𝛽𝛽2 sin2 𝐵∆ 𝐵2
+ 𝑈𝛽𝜄𝛽 sin 2𝜄13
sin 1−𝐵 ∆ 1−𝐵 sin 𝐵∆ 𝐵
cos 𝜀 + ∆
SLIDE 21
𝐒𝐟𝐛𝐝𝐮𝐩𝐬 𝐟𝐲𝐪𝐟𝐬𝐣𝐧𝐟𝐨𝐮𝐭
At about the same time, new reactor experiments (RENO, Double Chooz & Daya bay) independently measured sin22𝜄13 via disappearance: 𝑄 ν𝑓 → ν𝑓 ≈ 1 − sin22𝜄13 sin2 ∆ 2017: This is now the most precise input to the appearance prob. 𝑄 ν𝜈 → ν𝑓
RENO
EH2
Daya Bay
EH1
Daya Bay (Ling Ao) Double Chooz
RENO FD
SLIDE 22 𝐔𝟑𝐋 + 𝐬𝐟𝐛𝐝𝐮𝐩𝐬𝐭.
At about the same time, new reactor experiments (RENO, Double Chooz & Daya bay) independently measured sin22𝜄13 via disappearance:
𝑄 ν𝜈 → ν𝑓 ≈ sin2𝜄23sin22𝜄13 sin2 1 − 𝐵 ∆ 1 − 𝐵 2 +𝛽 sin2𝜄23sin2𝜄12sin2𝜄13cos𝜄13 sin 1 − 𝐵 ∆ 1 − 𝐵 sin 𝐵∆ 𝐵 cos 𝜀 + ∆
∆= ∆𝑛31
2 𝑀
4𝐹 𝛽 = ∆𝑛𝟑1
2
∆𝑛31
2
𝐵 = ൗ 2 2𝐻𝐺𝑜𝑓𝐹 ∆𝑛31
2
SLIDE 23 𝐔𝟑𝐋 + 𝐬𝐟𝐛𝐝𝐮𝐩𝐬𝐭
At about the same time, new reactor experiments (RENO, Double Chooz & Daya bay) independently measured sin22𝜄13 via disappearance:
𝑄 ν𝜈 → ν𝑓 ≈ sin2𝜄23sin22𝜄13 sin2 1 − 𝐵 ∆ 1 − 𝐵 2 +𝛽 sin2𝜄23sin2𝜄12sin2𝜄13cos𝜄13 sin 1 − 𝐵 ∆ 1 − 𝐵 sin 𝐵∆ 𝐵 cos 𝜀 + ∆ Goal: To find out the remaining unknowns; 𝜀, and sign ∆ [ i.e. whether or not 𝑛3
2 > 𝑛1 2 ] ∆= ∆𝑛31
2 𝑀
4𝐹 𝛽 = ∆𝑛𝟑1
2
∆𝑛31
2
𝐵 = ൗ 2 2𝐻𝐺𝑜𝑓𝐹 ∆𝑛31
2
SLIDE 24 𝐔𝟑𝐋 + 𝐬𝐟𝐛𝐝𝐮𝐩𝐬𝐭
At about the same time, new reactor experiments (RENO, Double Chooz & Daya bay) independently measured sin22𝜄13 via disappearance: We already knew sin2𝜄12 and 𝛽 from solar neutrino experiments
𝑄 ν𝜈 → ν𝑓 ≈ sin2𝜄23sin22𝜄13 sin2 1 − 𝐵 ∆ 1 − 𝐵 2 +𝛽 sin2𝜄23sin2𝜄12sin2𝜄13cos𝜄13 sin 1 − 𝐵 ∆ 1 − 𝐵 sin 𝐵∆ 𝐵 cos 𝜀 + ∆
∆= ∆𝑛31
2 𝑀
4𝐹 𝛽 = ∆𝑛𝟑1
2
∆𝑛31
2
𝐵 = ൗ 2 2𝐻𝐺𝑜𝑓𝐹 ∆𝑛31
2
SLIDE 25 𝐔𝟑𝐋 + 𝐬𝐟𝐛𝐝𝐮𝐩𝐬𝐭
At about the same time, new reactor experiments (RENO, Double Chooz & Daya bay) independently measured sin22𝜄13 via disappearance: We already knew sin2𝜄12 and 𝛽 from solar neutrino experiments Can also reduce the second ‘sinc’ function to just ∆
𝑄 ν𝜈 → ν𝑓 ≈ sin2𝜄23sin22𝜄13 sin2 1 − 𝐵 ∆ 1 − 𝐵 2 +𝛽 sin2𝜄23sin2𝜄12sin2𝜄13cos𝜄13 sin 1 − 𝐵 ∆ 1 − 𝐵 𝛽∆ cos 𝜀 + ∆
∆= ∆𝑛31
2 𝑀
4𝐹 𝛽 = ∆𝑛𝟑1
2
∆𝑛31
2
𝐵 = ൗ 2 2𝐻𝐺𝑜𝑓𝐹 ∆𝑛31
2
SLIDE 26 𝐔𝟑𝐋 + 𝐬𝐟𝐛𝐝𝐮𝐩𝐬𝐭
At about the same time, new reactor experiments (RENO, Double Chooz & Daya bay) independently measured sin22𝜄13 via disappearance: We already knew sin2𝜄12 and 𝛽 from solar neutrino experiments Can also reduce the second ‘sinc’ function to just ∆
And sin22𝜄23 is measured by ν𝜈 disappearance results
𝑄 ν𝜈 → ν𝑓 ≈ sin2𝜄23sin22𝜄13 sin2 1 − 𝐵 ∆ 1 − 𝐵 2 + sin2𝜄23sin2𝜄12sin2𝜄13cos𝜄13 sin 1 − 𝐵 ∆ 1 − 𝐵 𝛽∆ cos 𝜀 + ∆
∆= ∆𝑛31
2 𝑀
4𝐹 𝛽 = ∆𝑛𝟑1
2
∆𝑛31
2
𝐵 = ൗ 2 2𝐻𝐺𝑜𝑓𝐹 ∆𝑛31
2
SLIDE 27 𝐕𝐨𝐪𝐛𝐝𝐥𝐣𝐨𝐡 𝐮𝐢𝐟 𝐪𝐬𝐩𝐜𝐛𝐜𝐣𝐦𝐣𝐮𝐳
Split the cos(𝜀 + Δ) term and we find that the second term is the equation of an ellipse.
𝑄 ν𝜈 → ν𝑓 ≈ sin2𝜄23sin22𝜄13 sin2 1 − 𝐵 ∆ 1 − 𝐵 2 + sin2𝜄23sin2𝜄12sin2𝜄13cos𝜄13 sin 1 − 𝐵 ∆ 1 − 𝐵 𝛽∆ cos∆ cos𝜀 − sin2𝜄23sin2𝜄12sin2𝜄13cos𝜄13 sin 1 − 𝐵 ∆ 1 − 𝐵 𝛽∆ sin∆ sin𝜀
∆= ∆𝑛31
2 𝑀
4𝐹 𝛽 = ∆𝑛𝟑1
2
∆𝑛31
2
𝐵 = ൗ 2 2𝐻𝐺𝑜𝑓𝐹 ∆𝑛31
2
SLIDE 28 𝐕𝐨𝐪𝐛𝐝𝐥𝐣𝐨𝐡 𝐮𝐢𝐟 𝐪𝐬𝐩𝐜𝐛𝐜𝐣𝐦𝐣𝐮𝐳
Split the cos(𝜀 + Δ) term and we find that the second term is the equation of an ellipse. The relative amplitudes are calculated to show they are quite similar. Here Φ =
2Δ 𝜌 = Δ𝑛31
2 𝑀
2𝜌𝐹
(= 2n − 1 at the nth maximum)
𝑄 ν𝜈 → ν𝑓 ≈ sin2𝜄23sin22𝜄13 sin2 1 − 𝐵 ∆ 1 − 𝐵 2 + sin2𝜄23sin2𝜄12sin2𝜄13cos𝜄13 sin 1 − 𝐵 ∆ 1 − 𝐵 cos∆ cos𝜀 − sin2𝜄23sin2𝜄12sin2𝜄13cos𝜄13 sin 1 − 𝐵 ∆ 1 − 𝐵 sin∆ sin𝜀 𝑙0[≃ 0.049] 𝑙CP ≃ 0.014 × Φ 𝑙CP ≃ 0.014 × Φ
SLIDE 29 Drawn for a particular energy, as a function of 𝜀 and the mass hierarchy.
- The size of 𝑙0 specified the centre
- f the ellipse (in vacuum).
𝑄 ҧ 𝜉𝜈 → ҧ 𝜉𝑓 ≈ 𝑙0
sin2 1−𝐵 ∆ 1−𝐵 2
+ 𝑙CPΦ sin 1−𝐵 ∆
1−𝐵
cos∆ cos𝜀 ∓ 𝑙CPΦ sin 1−𝐵 ∆
1−𝐵
sin∆ sin𝜀
− −
SLIDE 30 Drawn for a particular energy, as a function of 𝜀 and the mass hierarchy.
- The size of 𝑙0 specified the centre
- f the ellipse (in vacuum).
- A nonzero value of 𝐵 splits the
ellipses.
𝑄 ҧ 𝜉𝜈 → ҧ 𝜉𝑓 ≈ 𝑙0
sin2 1−𝐵 ∆ 1−𝐵 2
+ 𝑙CPΦ sin 1−𝐵 ∆
1−𝐵
cos∆ cos𝜀 ∓ 𝑙CPΦ sin 1−𝐵 ∆
1−𝐵
sin∆ sin𝜀
− −
SLIDE 31 Drawn for a particular energy, as a function of 𝜀 and the mass hierarchy.
- The size of 𝑙0 specifies the centre
- f the ellipse (in vacuum).
- A nonzero value of 𝐵 splits the
ellipses.
- The sin𝜀 term causes CP violation.
𝑄 ҧ 𝜉𝜈 → ҧ 𝜉𝑓 ≈ 𝑙0
sin2 1−𝐵 ∆ 1−𝐵 2
+ 𝑙CPΦ sin 1−𝐵 ∆
1−𝐵
cos∆ cos𝜀 ∓ 𝑙CPΦ sin 1−𝐵 ∆
1−𝐵
sin∆ sin𝜀
− −
SLIDE 32 Drawn for a particular energy, as a function of 𝜀 and the mass hierarchy.
- The size of 𝑙0 specifies the centre
- f the ellipse (in vacuum).
- A nonzero value of 𝐵 splits the
ellipses.
- The sin𝜀 term causes CP violation.
- The cos𝜀 term causes a CP
conserving effect (with opposite sign between NH and IH)
𝑄 ҧ 𝜉𝜈 → ҧ 𝜉𝑓 ≈ 𝑙0
sin2 1−𝐵 ∆ 1−𝐵 2
+ 𝑙CPΦ sin 1−𝐵 ∆
1−𝐵
cos∆ cos𝜀 ∓ 𝑙CPΦ sin 1−𝐵 ∆
1−𝐵
sin∆ sin𝜀
− −
SLIDE 33 Measure neutrino and anti-neutrino appearance probabilities. Other parameters need to be constrained to sufficient precision. Then can establish value of 𝜀 and sign Δ𝑛31
2
. But may be ambiguous
- Degenerate solutions
- Or just because of finite resolution.
𝑄 ҧ 𝜉𝜈 → ҧ 𝜉𝑓 ≈ 𝑙0
sin2 1−𝐵 ∆ 1−𝐵 2
+ 𝑙CPΦ sin 1−𝐵 ∆
1−𝐵
cos∆ cos𝜀 ∓ 𝑙CPΦ sin 1−𝐵 ∆
1−𝐵
sin∆ sin𝜀
− −
SLIDE 34 Hand-waving summary of T2K results
There’s a catch here.
𝑄 𝜉𝜈 → 𝜉𝑓 ≈ 𝑙0
sin2 1−𝐵 ∆ 1−𝐵 2
+ 𝑙CPΦ sin 1−𝐵 ∆
1−𝐵
cos∆ cos𝜀 − 𝑙CPΦ sin 1−𝐵 ∆
1−𝐵
sin∆ sin𝜀
The bi-probablitiy plots are drawn for a single neutrino energy, but a real beam has a range of energies. However, if one naively converts from event rates to probabilities you get a rough idea of what T2K’s (2016) measurement implies.
SLIDE 35 The energy spectrum does matter though; can we find a way to show this? Choose 3 representative points
- Take the peak of the neutrino
(interaction) spectrum. This value is commonly used as a summary. This divides the spectrum into 2 ‘tails’
- Scan to the left & find the median
- f the lower tail.
- Scan to the right and do the same
Now 50% of the spectrum will be between green and red
SLIDE 36
The energy spectrum does matter though; can we find a way to show this? Now calculate ellipses for each energy: 520, 620 and 770 MeV Can see there is some justification for just integrating across the spectrum, even if it isn’t perfect.
SLIDE 37 Finally, estimate the sensitivity a single probability ellipse.
- Number of events estimated
for nominal exposure* (T2K: 0.75 MW × 5 years)
- 3 ellipses and we ignored
extreme tails, so assume 25% of expected events contribute to each.
- Then estimate fractional error
as a function of estimated signal and background at particular probabilities: 𝑇 + 𝐶 𝑇
*3:1 RHC:FHC similar numbers of 𝝃 and ഥ 𝝃
SLIDE 38 A short history of the Kamioka program Neutrino oscillation physics & T2K Hyper-K and the Korean detector
2017/06/21
SLIDE 39 In the next ~5y we expect (4×) more data from T2K, plus full results from NOvA. In addition we may have useful measurements from non- LBL experiments (e.g. IceCube). In 10~20y: Next generation experiments - Hyper-K and Dune T2K best fit is one of the ‘easy points’. Consider 2 options: 1. T2K is correct, and other experiments agree
– Fair chance that T2K + NO𝜉A + IceCube together favour NH at “> 3𝜏”
- IceCube and NOvA both have higher sensitivity to mass hierarchy
– Most important goal is to establish CPv, and then measure 𝜀.
2. T2K best fit is not correct, &/or other experiments disagree
– Testing measurements in other regimes is useful. Unlikely to be able to resolve disagreement without different data.
SLIDE 40 Hyper-K is the proposed next generation WC detector. The baseline design calls for 2 new tanks, both situated in a mine near the existing Kamioka Lab.
- Each tank is 5× larger than Super-K (8× after fiducial cuts)
- 40% photocoverage
(same as Super-K)
- Single-photon detection eff of 24%
(twice that of Super-K PMTs)
- Timing ~1ns (Super-K 2~3ns)
74m 60m
SLIDE 41
Hyper-K (1 tank × 10y) compared to T2K nominal
Stats ellipses get smaller, giving better sensitivity
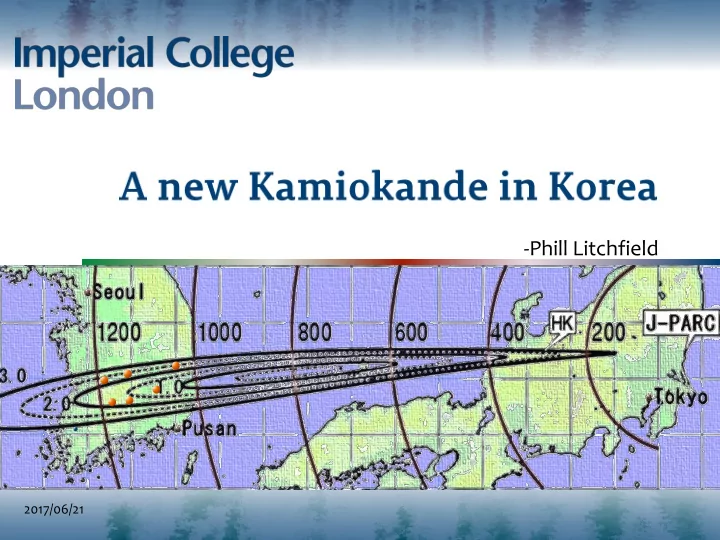
SLIDE 42 The 2 tanks in the baseline design are staged, with the second tank coming into use 6 years after the first. An alternative possibility is to put a second tank in Korea (“T2HKK”)
- Work on the second tank could conceivably start much sooner
- This is possible because of the off-axis choice
– The beam is below (and slightly to the south of) the Super-K at 295km – The centre surfaces at a distance of about 800km, in the Sea of Japan – The 2.5° cone around this point extends to about 1250km, past the west coast of South Korea.
Beam Axis
2.5°
SLIDE 43 The 2 tanks in the baseline design are staged, with the second tank coming into use 6 years after the first. An alternative possibility is to put a second tank in Korea
- Work on the second tank could conceivably start much sooner
- This is possible because of the off-axis choice (c.f. NuMI, Dune)
SLIDE 44 Obviously, the baseline is longer. Candidate sites In Korea are between 1000km and 1200km, i.e. 3~4× times as distant as Kamioka
- Can observe the second oscillation maxima
- Flux drops as 𝑀−2, therefore stat. uncertainties grow as 𝑀
- The interesting oscillation terms grow as ~𝑀
There is more freedom to choose a different off-axis angle
- Means we can choose a beam energy to optimise measurement.
Site choice can follow 2 principles: 1. Minimise off-axis angle for higher energy, increasing matter effect 2. Stay at similar off-axis angle to Super-K (and ND280 detectors) to cancel systematic uncertainties “ratio measurement”
Effects cancel out
SLIDE 45 1. Minimise off-axis angle for higher energy, increasing matter effect 2. Stay at similar off-axis angle to Super-K (and ND280 detectors) to cancel systematic uncertainties “ratio measurement”
Site Distance Angle
/km
Kamioka 295 2.52°
1089 1.31°
1142 1.93°
1170 2.06°
1043 2.29°
1145 2.38°
1190 2.21°
SLIDE 46
SLIDE 47
Bisul Bohyun
SLIDE 48 𝐃𝐐 𝐮𝐟𝐬𝐧 𝐟𝐨𝐢𝐛𝐨𝐝𝐟𝐧𝐟𝐨𝐮
The CP violating (& CP conserving) term is enhanced! For Φ ≪ 32 (i.e. as long as solar terms are small) this enhancement cancels out the statistical loss… Remember the appearance probability: 𝑄 𝜉𝜈 → 𝜉𝑓 ≈ 𝑙0
sin2 1−𝐵 ∆ 1−𝐵 2
+ 𝑙CPΦ sin 1−𝐵 ∆
1−𝐵
cos∆ cos𝜀 − 𝑙CPΦ sin 1−𝐵 ∆
1−𝐵
sin∆ sin𝜀 Where 𝑙0 ≃ 0.049 and 𝑙CP ≃ 0.014 The factor Φ = 2Δ
𝜌 is:
1 at the first maximum 3 at the second maximum
SLIDE 49 The CP violating (& CP conserving) term is enhanced! For Φ ≪ 32 (i.e. as long as solar terms are small) this enhancement cancels out the statistical loss… Time to see what it looks like in
- practice. Remember, the CP
parameters control the size of the ellipses. [Also note: these are made with with full numerical calculation.]
Kamioka, for comparison
SLIDE 50
Kamioka compared to Bohyun (2.29° off-axis site)
SLIDE 51
𝐎 𝐪𝐛𝐬𝐛𝐧𝐟𝐮𝐟𝐬𝐭
‘The CP term enhancement cancels out the statistical loss…’ …can see this wasn’t the whole story! The interesting part is in the nuisance parameters. There are two helpful features: Because the stat error grows while preserving sensitivity, any systematic that is a fixed size is a factor 3 less important.
SLIDE 52
𝐎 𝐪𝐛𝐬𝐛𝐧𝐟𝐮𝐟𝐬𝐭
The second helpful feature is a little less obvious. To affect a measurement, a nuisance parameter must mimic the oscillation signal. Example: Suppose the excess in current T2K results is an unknown systematic, rather than a fluctuation. It is quite easy for it to mimic a signal, because at Kamioka more 𝝃𝒇 favours ‘NH, 𝜺 = −𝝆/𝟑’ for all energies.
SLIDE 53
𝐎 𝐪𝐛𝐬𝐛𝐧𝐟𝐮𝐟𝐬𝐭
The second helpful feature is a little less obvious. To affect a measurement, a nuisance parameter must mimic the oscillation signal. Example: Suppose the excess in current T2K results is an unknown systematic, rather than a fluctuation. But for (e.g. Bohyun) interpretation is different at different energies. The systematic does not mimic (the same) oscillations
SLIDE 54 In a word: yes. Plot from T2K-II (T2K run extension) LOI.
- Hyper-K proposal equivalent to much higher POT
T2K-I nominal
SLIDE 55
𝜺
For discovery of CP non-conservation the important statistical issue is “How likely is my measurement to be a fluctuation from a CP conserving point”
SLIDE 56
𝜺
For discovery of CP non-conservation the important statistical issue is “How likely is my measurement to be a fluctuation from a CP conserving point” But to measure 𝜀 the statistical question is different: “How likely is is my measurement to be a fluctuation from any other point” For textbook linear problems, the distinction is not important. But here it is.
SLIDE 57
𝜺
For actually making a measurement the more open ellipses associated with the Korean sites helps too.
SLIDE 58 Now consider just the leading (𝑙0) term: 𝑄 𝜉𝜈 → 𝜉𝑓 ≈ 𝑙0
sin2 1−𝐵 ∆ 1−𝐵 2
where 𝐵 ≃ Τ 𝐹 10GeV The amplitude of the oscillation will scale by 1 − 𝐵 −2 for all maxima. But the position of the oscillation maximum is shifted by 𝐵Δ, which is 3 times larger at 2nd maxima. Energy Baseline Notes Effect size Amplitude Position 0.6 GeV 300 km Like T2K 113% 6% 0.6 GeV 900km 2nd max 113% 18% 1.8 GeV 900km Like Bisul, NOvA 149% 18%
SLIDE 59
SLIDE 60 At medium (970MeV) and high (1300MeV) energies, the two hierarchies can be completely distinguished. There is actually better separation than at NOvA (event though it has higher energy)
- CP term does not mimic matter
effect for Bisul configuration Also around 970MeV, NH enhances 𝑄 ҧ 𝜉𝜈 → ҧ 𝜉𝑓 , opposite effect to normal (1st maxima) configurations.
SLIDE 61 Korean detector WG are now working on full sensitivities using code derived from T2K analyses. Current generation includes event selections, contamination and finite resolution, but does not include systematics or other oscillation parameters as nuisance parameters. As a result, can get a feel for sensitivity, but not yet able to investigate the degeneracy-breaking effects highlighted. Also uses old fluxes for generic sites: 1100km at (1.5°, 2.0°, 2.5°) off-axis, together with a detector at Kamioka (295km, 2.5°).
- 2 detectors at Kamioka (both full 10y) shown for comparison.
SLIDE 62
SLIDE 63
SLIDE 64
𝜺
SLIDE 65 For proton decay searches and natural (solar, atmospheric, supernova, relic) neutrinos there is no compelling reason for 2 Hyper-K tanks to be near each other.
- In fact, because the Hyper-K site is quite shallow (~650m), a deeper
site in Korea (expected ~800m) is actually preferable. For long baseline physics there is a unique opportunity to reuse an existing beamline for a 2nd-maximum measurement.
- The increased effect size largely compensates for lower statistics
- Faster oscillations nearer the 2nd maximum mean the same spectrum
covers a larger interval of the oscillation pattern
- Sensitivity to most parameters improves overall, and importance of
systematics is reduced
- Provides a very interesting test of the model in a new regime
White paper on arXiv: 1611.6118
SLIDE 67 For energies /MeV: G 530 B 640 R 800 The combination of larger off- axis angle and long baseline means that the low energy tail (green) is sampling the 3rd (!)
- scillation peak, while the
upper tail (red) is vary close to the 2nd oscillation peak.
SLIDE 68
For energies /MeV: G 620 B 780 R 960 This is quite similar to Bohyun in terms of L/E regime probed Green NH is interesting: At this energy antineutrino rate is almost independent of delta (but other energies still see effect)
SLIDE 69
For energies /MeV: G 590 B 740 R 920
SLIDE 70
For energies /MeV: G 570 B 700 R 860 This is similar to Mt Minjuji, but with longer baseline and higher energy.