
SLIDE 1
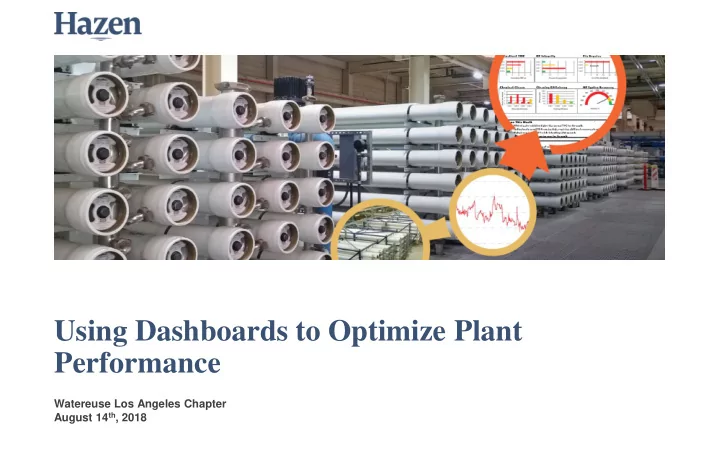
Using Dashboards to Optimize Plant Performance
Watereuse Los Angeles Chapter August 14th, 2018
Performance Watereuse Los Angeles Chapter August 14 th , 2018 - - PowerPoint PPT Presentation
Using Dashboards to Optimize Plant Performance Watereuse Los Angeles Chapter August 14 th , 2018 Proactive vs Reactive Operations Knowledge Operations back Incident of Potential on track Issue Identifying Issue, Field Testing, Water
Watereuse Los Angeles Chapter August 14th, 2018
Asset Management Training Standard Operating Procedures Dashboards Process Optimization
Identify Key Performance Indicators Develop Target Values (Design) Identify Equipment and Instrument Tags Data Storage, Handling and Cleanup Methods Create Dashboard Reports
Process Optimization
RO Dashboard