
SLIDE 1
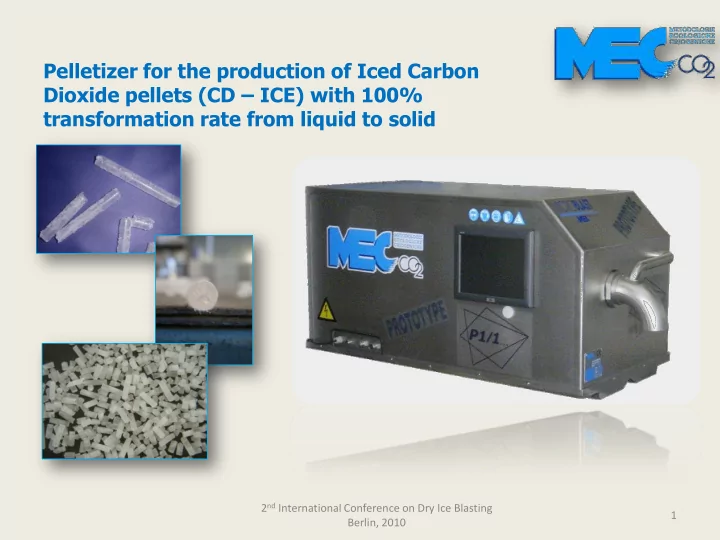
Pelletizer for the production of Iced Carbon Dioxide pellets (CD – ICE) with 100% transformation rate from liquid to solid
1 2nd International Conference on Dry Ice Blasting Berlin, 2010
Pelletizer for the production of Iced Carbon Dioxide pellets (CD - - PowerPoint PPT Presentation
Pelletizer for the production of Iced Carbon Dioxide pellets (CD ICE) with 100% transformation rate from liquid to solid 2 nd International Conference on Dry Ice Blasting 1 Berlin, 2010 Abstract The present state of the art in the
Pelletizer for the production of Iced Carbon Dioxide pellets (CD – ICE) with 100% transformation rate from liquid to solid
1 2nd International Conference on Dry Ice Blasting Berlin, 2010
2nd International Conference on Dry Ice Blasting Berlin 2010 2
The present state of the art in the construction of dry ice pelletizer allows the realization of mechanic producer of dry ice pellets with standard density and the realisation of hydraulic pelletizer for the production of pellets with high density. The transformation rate from Liquid CO2 into the solid phase is about 38-40% whereas the remaining part (60-62%) turns into CO2gas. The P1/1 Pelletizer can realise a 100% transformation of the Liquid CO2 into a solid phase with the under cooling of the Liquid CO2 into iced CO2 using Liquid Nitrogen. The advantages compared with traditional pelletizer are:
erasing completely the discharge of the CO2 gas which is usually released in the atmosphere with a perceptible benefit on the greenhouse effect.
advantages:
These advantages lead to a longer shelf life of the CD - ICE during the storage and better performance when used for blasting.
about 52/54% compared with the dry ice one.
2nd International Conference on Dry Ice Blasting Berlin 2010 3
63% 24% 10% 3%
CO2 Methane Nitrous oxide Others
The CO2 is the gas which contribuites mostly to the Greenhouse effect
Contribution to the increase of the Greenhouse effect from the most Important greenhouse gas.
Before the beginning of the Industrial Revolution, for 800 years (and maybe more), the concentration
Today is almost 380 ppm and growsalmost 1 ppm per year
2nd International Conference on Dry Ice Blasting Berlin 2010 4
2nd International Conference on Dry Ice Blasting Berlin 2010 5
The Carbon Dioxide is an acid oxide composed by one atom of Carbon linked to two atoms of oxigen . It is a Fundamental substance in the vital process of plants and animals. The carbon Dioxide is considered one of the greenhouse gas present In the earth’s atmosphere. At ambient temperature and pressure the Carbon Dioxide is colourless and odourless . Its Chemical formula is CO2. At a solid phase is called “Dry Ice”. It sublimates at –78°C. The molecule of the Carbon Dioxide is linear. The Carbon has a number of oxidation 4+ , so it is at its maximum phase of oxidation possible. Conseguently, the Carbon Dioxide is not flammable and from the chimical point of view is relatively inert. The Carbon Dioxide is colourless and odourless; it is not toxic but it is not breathable so it can cause the death of Asphyxiation. Breathing an atmosphere particularly full of CO2 produces an acidulous flavour in your mouth and irritation in your nose and in your throat ; this is due to its reaction with water for the formation of Carbonic Acid. The density of Carbon Dioxide, at ambient temperature and pressure is about one time and half the density
temperature up to –78°C and at ambient pressure, the Carbon Dioxide doesn’t melt but sublimates. The Carbon dioxide is known also as dry ice. The dry ice ( solid carbon dioxide) is used for the Dry Ice Blasting. The dry ice is made with the compression
2nd International Conference on Dry Ice Blasting Berlin2010 6
The expansion causes a sinking of the temperature that makes the carbon dioxide freezing into crystals similar to the snow , which are then compressed. In an atmosphere of carbon Dioxide, the fire goes out. Between the food additive the Carbon Dioxide is identified by E 290. The limits imposed by the OSHA – Occupational Safety & Health Administration ( The US agency for job safety an Health) for the concentration of Carbon Dioxide at work are 0,5% (5000ppm) for a continous exposition and the 3% for a short exposition (15 minutes). In 2007, about 0,038% ( ≈ 381 ppm )in volume of carbon dioxide was measured in the eart’s athmosphere. Despite of its small concentration, the CO2 is a fundamental component in the earth’s atmosphere because, together with the water vapour and the methane, it trappes the infrared radiation of the sunlight riflecting it again towards the earth’s surface ( the so called Greenhouse effect), preventing the Earth to cool down. It is estimated that the atmospherical concentration of Carbon dioxide before the Industrial Revolution was 280 ppm, then it increased by 35% since the Industrial Revolution and 20% from 1958. The theroy of the global warming appeared for the first time in the scientific litterature at the end of XIX Century. The increase of Carbon Dioxide in the atmosphere augments the Greenhouse effect and it contributes then at the raise of the average temperature of the planet, to which ecosystems have no time to adapt.
2nd International Conference on Dry Ice Blasting Berlin 2010 7
2nd International Conference on Dry Ice Blasting Berlin 2010 8
2nd International Conference on Dry Ice Blasting Berlin 2010 9
2nd International Conference on Dry Ice Blasting Berlin 2010 10
Balance report pressure/temperature of the CO
2
Temperature Relative Pressure Density °C Bar Solid /gas
0,328
0,964
1,852
3,078 Triple Point
4,172 1,177
4,53
5,816
7,311
9,037
11,02 1,095
13,27 1,074
15,82 1,052
18,69 1,03 Liquid/gas
21,9 1,006
25,48
29,45 33,84 5 38,67 10 43,99 15 49,83 20 56,25 25 63,3 30 71,06 Critical Point 31,06 72,81 0,464
2nd International Conference on Dry Ice Blasting Berlin 2010 11
Triple Point
Temperature Pressure Specific Volume °C bar
4,1 1,178 - Liquid + gas
4,1 1,513 - Solid + gas Absolute Pressure Temperature °C Latent Heat bar Boiling vaporization - Kcal/kg 20
68 15
72 8
79
ATTITUDE OF THE SOLID CO2 At T = - 78,5°C and P = 1 absolute bar for sublimation it absorbs 136,4 Kgcal / kg 1dm3 develops 835Lt of gas 1dm3 weights 1,562kg
2nd International Conference on Dry Ice Blasting Berlin 2010 12
At present, the known process used for the production of dry ice pellets, contemplate the use of liquid carbon dioxide (CO2) , what is expanded in order to produce snow carbon dioxide; the snow carbon dioxide is then pressed and is passed though a die for the production of cylinders (pellets) of dry ice. The Liquid CO2 is available in the market in cylinder at the ambient temperature, that is at 20°C and 57 bar pressure (MPT – Middle Pressure Tank), or then it is stored in thermal insulated tank at –20°C and at 20 bar pressure (LPT – Low Pressure Tank). The field of use of the CO2 at the liquid phase goes from the critical point (31°C /74 bar) to the Triple point ( -56,6°C / 5,18 bar). According to the known process, the Liquid CO2 tapped from tanks like MPT or LPT is expanded in a room where pressure can vary from 0 and 2,5 bar or below the triple point pressure by 5,18 bar in order to produce dry ice. The transformation percentage of the liquid CO2 in snow carbon dioxide is variable and it depends to the initial temperature and pressure conditions; indicatively, the transformation percentage can vary from about 20% for high pressure and temperature ( cylinders MPT) to about 40% for Low pressure and temperatures (tanks LPT). The fraction not transformed in dry ice is composed by CO2 Vapour which is generally recovered in order to be used once again in the process: this allows a certain saving of the raw materials but it implies inevitably further costs for the process and for the plant.
2nd International Conference on Dry Ice Blasting Berlin 2010 13
Alternatively, it is also possible to release CO2 vapour in the atmosphere but this implies higher costs concerning the raw material and this is not acceptable from the ecological point of view, because the CO2 is considered a greenhouse gas. However, from the phase diagram of the carbon dioxide it is possible to deduce that if the Liquid CO2 is cooled down below the temperature of the sublimation point at 1 bar, i.e. at about -78,5°C and at a higher pressure than the triple point i.e. 5,18 bar, the liquid CO2 transforms all in solid: therefore, even at the atmospherically pressure (1 bar), the CO2 remains solid, without expanding and without producing the gaseous phase. In this way, it is theorically realized the complete transformation of the liquid CO2 into the solid phase, it means with a theorical percentage of transformation equal to 100%. According to these observations, M.E.C. has registered a patent which object is the invention of a new plant and of a new process for the production of Iced Carbon Dioxide pellets, which enables the complete transformation of the Liquid carbon dioxide into the solid phase, without the middle phase of the transformation in snow carbon dioxide and so without the recovering and / or the loss of gaseous fractions. Practically, the new process consists of cooling down the Liquid carbon dioxide using the Liquid Nitrogen in
2nd International Conference on Dry Ice Blasting Berlin 2010 14
In the process patented by M.E.C. , the liquid carbon dioxide is passed through a heat exchanger where the Liquid Nitrogen flows, i.e. a cooling liquid which removes the heat from the liquid carbon dioxide causing the cooling. One second heat exchanger installed inside the pelletizer provides to the solidification
ejection of CD – ICE pellets from the die is assured by an hydraulic system. The CD – ICE pellets are then removed and stored in a container at the atmospheric pressure and at a temperature lower than the sublimation one ( about –78.5°C). At present, as already described, during the transformation of the Liquid CO2 in dry ice , there is a certain waste of vapour CO2, so on the average, to obtain 1kg of dry ice you need 2,8 kg of liquid CO2. This waste turns out high costs of the raw material and in emission in the atmosphere which can come out as unacceptable from the ecological point of view; if it is true that the CO2 wasted is generally recovered to be once again used in the process: and this allows a certain saving on the raw material, anyway there is no doubt that this recovering operation implies inevitably further costs for the process and the plant. With the new plant that M.E.C. will introduce in its own productive plant, all the liquid carbon dioxide will be completely transformed in solid carbon dioxide (CD - ICE); the percentage of transformation will be 100% that is to produce 1kg of CD - ICE it will be needed 1kg of liquid CO2.
2nd International Conference on Dry Ice Blasting Berlin 2010 15
The economic advantage is evident. Also the advantages in ecological terms are clear, quantifiable in a reduction of about 66% of the gaseous CO2 emissions in the atmosphere. The production costs will be halved: there will be in fact the reduction of about 2/3 (equal to 66%) of the raw material consumption (Liquid CO2) but the net advantage is valuable by about 50% costs reduction, as one should consider the additional cost of the Nitrogen used as coolant. The implementation of the new production process , will result in even higher quality standards for the realization of the product, both aesthetically than functionally. The traditional method of production of dry ice, involves the intermediate step of the transformation of the liquid carbon dioxide in snow carbon dioxide and then the subsequent compression in dry ice, implies the production of mat dry ice; differently, thanks to the new process, the final product will be transparent and denser. The higher density and hardness will make iced carbon dioxide pellets, widely used in blasting cleaning, the best performing. Thanks to the higher density, they can in fact release more kinetic energy; furthermore, owing to increased hardness, they will sublimate more slowly. The pellets produced will be then more aggressive and more performing in cleaning operations.
2nd International Conference on Dry Ice Blasting Berlin 2010 16
2nd International Conference on Dry Ice Blasting Berlin 2010 17
Comparison with water: CD – ICE pellets: Features
Slow – going sublimation Sharp – edged break line Harder than dry ice
Transformation of 100% liquid CO2 into solid phase compared to 40% with standard Pelletizers
Snowball Ice cube
Dry ice pellets
Carbon dioxide ice CD - ICE
2nd International Conference on Dry Ice Blasting Berlin 2010 18
19 2nd International Conference on Dry Ice Blasting Berlin 2010
2nd International Conference on Dry Ice Blasting Berlin 2010 20
1. Reduction of the Greenhouse effect of 66% due to the transformation of the Liquid CO2 in solid without gaseous phase (no wasted in the atmosphere) 2. Reduction of pellets production costs of up to 50% due to the full transformation of the CO2 in solid and CD – ICE pellets have a slower sublimation. 3. Better performing in blasting cleaning compared with dry ice blasting because CD – ICE is hardest, it has sharp – edges break line (more aggressive)
2nd International Conference on Dry Ice Blasting Berlin 2010 21
This page explains how to interpret the phase diagrams for simple pure substances - including a look at the special cases of the phase diagrams of water and carbon dioxide. This is going to be a long page, because I have tried to do the whole thing as gently as possible. The basic phase diagram What is a phase? At its simplest, a phase can be just another term for solid, liquid or gas. If you have some ice floating in water, you have a solid phase present and a liquid phase. If there is air above the mixture, then that is another phase. But the term can be used more generally than this. For example, oil floating on water also consists of two phases - in this case, two liquid phases. If the oil and water are contained in a bucket, then the solid bucket is yet another phase. In fact, there might be more than one solid phase if the handle is attached separately to the bucket rather than moulded as a part of the bucket. You can recognise the presence of the different phases because there is an obvious boundary between them - a boundary between the solid ice and the liquid water, for example, or the boundary between the two liquids.
2nd International Conference on Dry Ice Blasting Berlin 2010 22
Phase diagrams
A phase diagram lets you work out exactly what phases are present at any given temperature and pressure. In the cases we'll be looking at on this page, the phases will simply be the solid, liquid or vapour (gas) states of a pure substance. This is the phase diagram for a typical pure substance. These diagrams (including this one) are nearly always drawn highly distorted in order to see what is going on more
If you look at the diagram, you will see that there are three lines, three areas marked "solid", "liquid" and "vapour", and two special points marked "C" and "T".
2nd International Conference on Dry Ice Blasting Berlin 2010 23
The three areas
These are easy! Suppose you have a pure substance at three different sets of conditions of temperature and pressure corresponding to 1, 2 and 3 in the next diagram. Under the set of conditions at 1 in the diagram, the substance would be a solid because it falls into that area of the phase
Under the set of conditions at 1 in the diagram, the substance would be a solid because it falls into that area of the phase
Note: I'm using the terms vapour and gas as if they were interchangeable. There are subtle differences between them that I'm not ready to explain for a while yet. Be patient!
2nd International Conference on Dry Ice Blasting Berlin 2010 24
Moving from solid to liquid by changing the temperature:
Suppose you had a solid and increased the temperature while keeping the pressure constant - as shown in the next
it melts. If you repeated this at a higher fixed pressure, the melting temperature would be higher because the line between the solid and liquid areas slopes slightly forward.
2nd International Conference on Dry Ice Blasting Berlin 2010 25
Note: This is one of the cases where we distort these diagrams to make them easier to discuss. This line is much more vertical in practice than we normally draw it. There would be very little change in melting point at a higher pressure. The diagram would be very difficult to follow if we didn't exaggerate it a bit.
So what actually is this line separating the solid and liquid areas of the diagram? It simply shows the effect of pressure on melting point. Anywhere on this line, there is an equilibrium between solid and
pressure, the equilibrium will move in such a way as to counter the change you have just made.
2nd International Conference on Dry Ice Blasting Berlin 2010 26 If it converted from liquid to solid, the pressure would tend to decrease again because the solid takes up slightly less space for most substances. That means that increasing the pressure on the equilibrium mixture of solid and liquid at its original melting point will convert the mixture back into the solid again. In other words, it will no longer melt at this temperature. To make it melt at this higher pressure, you will have to increase the temperature a bit. Raising the pressure raises the melting point of most solids. That's why the melting point line slopes forward for most substances.
Moving from solid to liquid by changing the pressure:
You can also play around with this by looking at what happens if you decrease the pressure on a solid at constant temperature.
Note: You have got to be a bit careful about this, because exactly what happens if you decrease the pressure depends on exactly what your starting conditions are. We'll talk some more about this when we look at the line separating the solid region from the vapour region.
2nd International Conference on Dry Ice Blasting Berlin 2010 27
Moving from liquid to vapour:
In the same sort of way, you can do this either by changing the temperature or the pressure. The liquid will change to a vapour - it boils - when it crosses the boundary line between the two areas. If it is temperature that you are varying, you can easily read off the boiling temperature from the phase diagram. In the diagram above, it is the temperature where the red arrow crosses the boundary line. So, again, what is the significance of this line separating the two areas? Anywhere along this line, there will be an equilibrium between the liquid and the vapour. The line is most easily seen as the effect of pressure on the boiling point of the liquid. As the pressure increases, so the boiling point increases.
Note: I don't want to make any very big deal over this, but this line is actually exactly the same as the graph for the effect of temperature on the saturated vapour pressure of the
the saturated vapour pressure of a liquid at 50 C, and it turned out to be 75 kPa. You could plot that as one point on a vapour pressure curve, and then go on to measure other saturated vapour pressures at different temperatures and plot those as well. Now, suppose that you had the liquid exposed to a total external pressure of 75 kPa, and gradually increased the temperature. The liquid would boil when its saturated vapour pressure became equal to the external pressure - in this case at 50 C. If you have the complete vapour pressure curve, you could equally well find the boiling point corresponding to any other external pressure. That means that the plot of saturated vapour pressure against temperature is exactly the same as the curve relating boiling point and external pressure - they are just two ways of looking at the same thing. If all you are interested in doing is interpreting one of these phase diagrams, you probably don't have to worry too much about this.
2nd International Conference on Dry Ice Blasting Berlin 2010 28
The critical point
You will have noticed that this liquid-vapour equilibrium curve has a top limit that I have labelled as C in the phase diagram. This is known as the critical point. The temperature and pressure corresponding to this are known as the critical temperature and critical pressure. If you increase the pressure on a gas (vapour) at a temperature lower than the critical temperature, you will eventually cross the liquid-vapour equilibrium line and the vapour will condense to give a liquid.
What, though, if your temperature was above the critical temperature? There wouldn't be any line to cross!
condense a gas into a liquid just by increasing the pressure. All you get is a highly compressed gas. The particles have too much energy for the intermolecular attractions to hold them together as a liquid.
and depends on the strength of the attractions between the particles. The stronger the intermolecular attractions, the higher the critical temperature.
Note: This is now a good point for a quick comment about the use of the words "gas" and "vapour". To a large extent you just use the term which feels right. You don't usually talk about "ethanol gas", although you would say "ethanol vapour". Equally, you wouldn't talk about oxygen as being a vapour - you always call it a gas. There are various guide-lines that you can use if you want to. For example, if the substance is commonly a liquid at or around room temperature, you tend to call what comes away from it a vapour. A slightly wider use would be to call it a vapour if the substance is below its critical point, and a gas if it is above it. Certainly it would be unusual to call anything a vapour if it was above its critical point at room temperature - oxygen or nitrogen or hydrogen, for example. These would all be described as
2nd International Conference on Dry Ice Blasting Berlin 2010 29
Moving from solid to vapour:
There's just one more line to look at on the phase diagram. This is the line in the bottom left-hand corner between the solid and vapour areas. That line represents solid-vapour equilibrium. If the conditions of temperature and pressure fell exactly on that line, there would be solid and vapour in equilibrium with each other - the solid would be subliming. (Sublimation is the change directly from solid to vapour or vice versa without going through the liquid phase.) Once again, you can cross that line by either increasing the temperature of the solid, or decreasing the pressure. The diagram shows the effect of increasing the temperature of a solid at a (probably very low) constant pressure. The pressure
2nd International Conference on Dry Ice Blasting Berlin 2010 30
The triple point
Point T on the diagram is called the triple point. If you think about the three lines which meet at that point, they represent conditions of:
Where all three lines meet, you must have a unique combination of temperature and pressure where all three phases are in equilibrium together. That's why it is called a triple point. If you controlled the conditions of temperature and pressure in order to land on this point, you would see an equilibrium which involved the solid melting and subliming, and the liquid in contact with it boiling to produce a vapour - and all the reverse changes happening as well. If you held the temperature and pressure at those values, and kept the system closed so that nothing escaped, that's how it would stay. A strange set of affairs!
Normal melting and boiling points
The normal melting and boiling points are those when the pressure is 1 atmosphere. These can be found from the phase diagram by drawing a line across at 1 atmosphere pressure.
2nd International Conference on Dry Ice Blasting Berlin 2010 31 The phase diagram for water There is only one difference between this and the phase diagram that we've looked at up to now. The solid-liquid equilibrium line (the melting point line) slopes backwards rather than forwards. In the case of water, the melting point gets lower at higher pressures. Why? If you have this equilibrium and increase the pressure on it, according to Le Chatelier's Principle the equilibrium will move to reduce the pressure again. That means that it will move to the side with the smaller volume. Liquid water is produced. To make the liquid water freeze again at this higher pressure, you will have to reduce the temperature. Higher pressures mean lower melting freezing) points. Now lets put some numbers on the diagram to show the exact positions of the critical point and triple point for water.
2nd International Conference on Dry Ice Blasting Berlin 2010 32 Notice that the triple point for water occurs at a very low pressure. Notice also that the critical temperature is 374 C. It would be impossible to convert water from a gas to a liquid by compressing it above this temperature. The normal melting and boiling points of water are found in exactly the same way as we have already discussed - by seeing where the 1 atmosphere pressure line crosses the solid-liquid and then the liquid-vapour equilibrium lines.
Note: Further up the page I mentioned two ways in which these diagrams are distorted to make them easier to follow. I have already pointed out that the solid-liquid equilibrium line should really be much more vertical. This last diagram illustrates the other major distortion - which is to the scales of both pressure and temperature. Look, for example, at the gaps between the various quoted pressure figures and then imagine that you had to plot those on a bit of graph paper! The temperature scale is equally haphazard.
2nd International Conference on Dry Ice Blasting Berlin 2010 33 Just one final example of using this diagram (because it appeals to me). Imagine lowering the pressure on liquid water along the line in the diagram below. The phase diagram shows that the water would first freeze to form ice as it crossed into the solid area. When the pressure fell low enough, the ice would then sublime to give water vapour. In other words, the change is from liquid to solid to vapour. I find that satisfyingly bizarre! The phase diagram shows that the water would first freeze to form ice as it crossed into the solid area. When the pressure fell low enough, the ice would then sublime to give water vapour. In other words, the change is from liquid to solid to
2nd International Conference on Dry Ice Blasting Berlin 2010 34
The phase diagram for carbon dioxide
The only thing special about this phase diagram is the position of the triple point which is well above atmospheric pressure. It is impossible to get any liquid carbon dioxide at pressures less than 5.11 atmospheres. That means that at 1 atmosphere pressure, carbon dioxide will sublime at a temperature of -78 C. This is the reason that solid carbon dioxide is often known as "dry ice". You can't get liquid carbon dioxide under normal conditions - only the solid or the vapour.
Biography : Chemistry guide – http://www.chemistryguide.co.uk/physical/phaseeqia/phasediags.html
Viale Italia, 19 28010 Caltignaga (NO) – Italy Phone: +39 0321 653800 Fax: +39 0321 653007 mail: meccrios@tin.it net: www.meccrios.com net: www.ghiacciosecco.net
2nd International Conference on Dry Ice Blasting Berlin 2010 35