
SLIDE 1
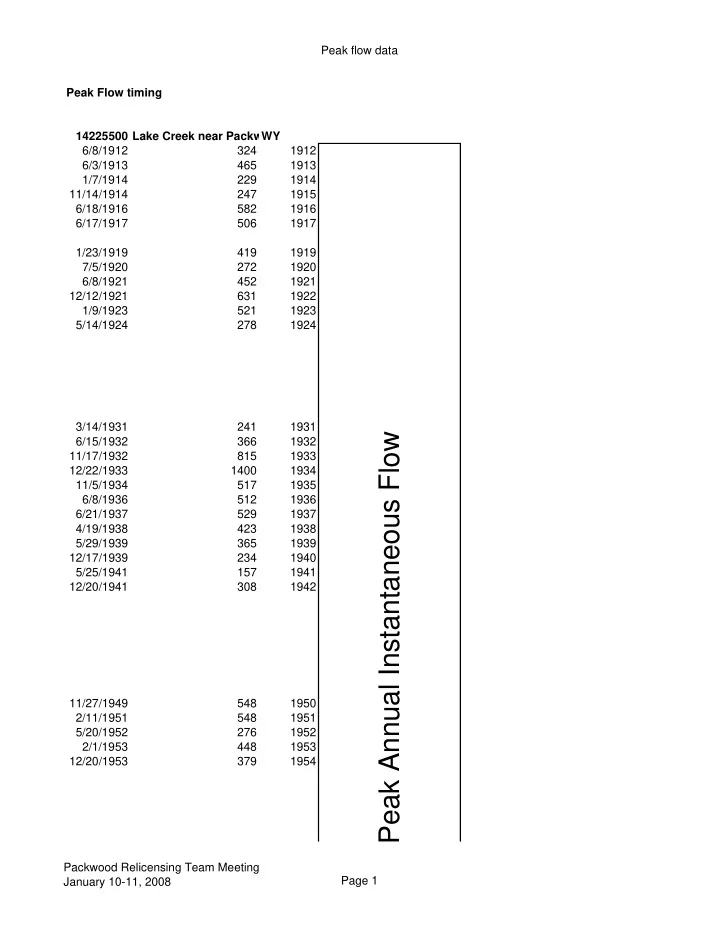
Peak flow data Peak Flow timing 14225500 Lake Creek near PackwWY 6/8/1912 324 1912 6/3/1913 465 1913 1/7/1914 229 1914 11/14/1914 247 1915 6/18/1916 582 1916 6/17/1917 506 1917 1/23/1919 419 1919 7/5/1920 272 1920 6/8/1921 452 1921 12/12/1921 631 1922 1/9/1923 521 1923 5/14/1924 278 1924 3/14/1931 241 1931 6/15/1932 366 1932 11/17/1932 815 1933 12/22/1933 1400 1934 11/5/1934 517 1935 6/8/1936 512 1936 6/21/1937 529 1937 4/19/1938 423 1938 5/29/1939 365 1939 12/17/1939 234 1940 5/25/1941 157 1941 12/20/1941 308 1942 11/27/1949 548 1950 2/11/1951 548 1951 5/20/1952 276 1952 2/1/1953 448 1953 12/20/1953 379 1954
Peak Annual Instantaneous Flow
Packwood Relicensing Team Meeting January 10-11, 2008 Page 1