
SLIDE 1
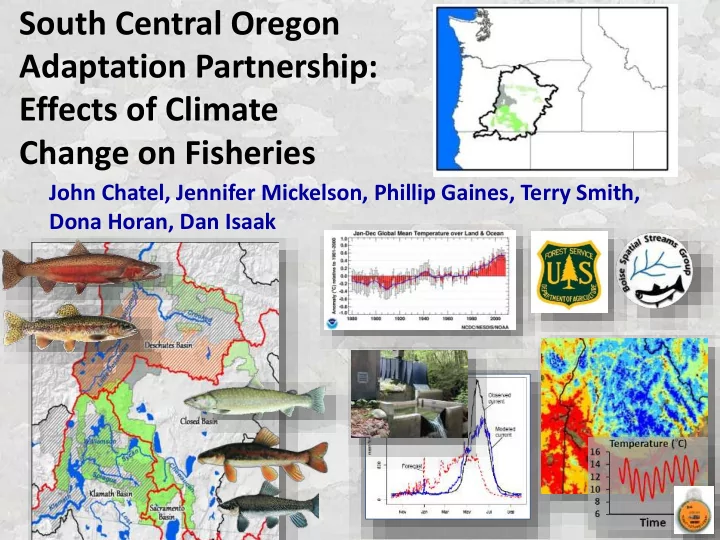
South Central Oregon Adaptation Partnership: Effects of Climate Change on Fisheries
John Chatel, Jennifer Mickelson, Phillip Gaines, Terry Smith, Dona Horan, Dan Isaak
Adaptation Partnership: Effects of Climate Change on Fisheries - - PowerPoint PPT Presentation
South Central Oregon Adaptation Partnership: Effects of Climate Change on Fisheries John Chatel, Jennifer Mickelson, Phillip Gaines, Terry Smith, Dona Horan, Dan Isaak Species of Concern Bull trout Critical habitat ESA listed as
John Chatel, Jennifer Mickelson, Phillip Gaines, Terry Smith, Dona Horan, Dan Isaak
populations to high-elevation refugia
fragmented & isolated
susceptible to disturbance
Critical habitat
connectivity to ocean
freshwater abundance
unsuitably cold upstream areas could serve as refugia
streams susceptible to disturbance
Critical habitat
Redband trout Stream Habitats
Forester considers to be “sensitive species”
steelhead
– unsuitably cold upstream areas could serve as refugia
flows
streams susceptible to disturbance
Lost River Sucker
but use inflowing streams for spawning
limited to ~40 kilometers
Fremont-Winema NF
Critical habitats Shortnose Sucker
Stream reach patterns Climate model (air temp & precip) Regional patterns Stream temperatures & flow
VIC
Stream reach patterns Climate model (air temp & precip) Regional patterns Stream temperatures & flow
VIC
Google “Stream flow Metrics”
VIC Streamflow Scenarios
Isaak et al. 2010. Ecol. Apps. 20:1350-1371 Isaak et al. 2012. Climatic Change 113:499-524. Luce et al. 2014. Wat Res Res DOI: 10.1002/2013WR014329 Ver Hoef et al. 2006. Environ Ecol Stat 13:449-464. Ver Hoef & Peterson. 2010. Journal Am Stat Ass 105:6–18. Liang et al. 1994. J. Geophys Res 99:14415–14428. Wenger et al. 2010. Water Res Res 46:W09513. Safeeq et al. 2014. Hydrology and Earth System Sciences 11:3315-3357.
Google “NorWeST stream temp”
Stream Hydrography Baseline for Fish
1:100,000 NHDPlus >0.2 cfs summer flow <15% slope Deleted intermittent channels
~65% network reduction
VIC
Baseline (1970-1999)
Baseline (1970-1999)
All Streams USFS Streams Historic 19,161 km 4,968 km
Stream Fish Hydrography
Data from all agencies &…
Baseline (1970-1999)
A1B 10 GCM Ensemble from CIG
(1970-1999)
A1B ~RCP 6.0
All lands USFS lands
Baseline (1970-1999)
2080s (2070-2099)
Summer flow
*VIC projections as modified by Safeeq et al. (2014)
Winter95 flow metric All lands USFS lands
Number
Days Increase Number
Days Increase
Baseline (1970-1999) 10.5
12.4 1.9 12.6 2.8 2080s (2070-2099) 13.2 2.7 13.8 4
Fall spawner egg & juvenile mortality Infrastructure impacts
All lands USFS lands
Baseline (1970-1999)
1.3°C 1.2°C 2080s (2070-2099) 2.2°C 2.0°C
Air temperature trends
Isaak et al. 2016. Slow climate velocities of mountain streams portend their role as refugia for cold-water biodiversity. Proc Nat Acad Sci
923 sites in NorWeST database with >10 year records
Isaak et al. 2016. Slow climate velocities of mountain streams portend their role as refugia for cold-water biodiversity. Proc Nat Acad Sci
923 sites in NorWeST database with >10 year records
Weather Stations
Cascades Eastern Slope Tributaries & John Day River
Number of high flow days Stream metric Period <5 5-10 >10 Winter 95% flow 1980s 0.1% 24% 76% 2040s 12% 88% 2080s 9% 91% m3/s <0.034 0.034-0.085 >0.085 Summer flow 1980s 9% 14% 77% 2040s 10% 14% 76% 2080s 11% 14% 75% Stream kilometers <8 8-11 11-14 14-17 17-20 >20 August temp 1980s 0.4% 6% 19% 38% 26% 11% 2040s 0.1% 2% 12% 29% 39% 18% 2080s 1% 8% 23% 39% 29%
37% and 33% respectively
condition
Throughout Analysis Area
will experience more than 10 days with the highest 5% winter peak flows
Number of high flow days Stream metric Period <5 5-10 >10 Winter 95% flow 1980s 0.1% 26% 73% 2040s 2% 98% 2080s 1% 99% m3/s <0.034 0.034-0.085 >0.085 Summer flow 1980s 17% 20% 63% 2040s 21% 20% 59% 2080s 23% 20% 56% Stream kilometers <8 8-11 11-14 14-17 17-20 >20 August temp 1980s 1% 8% 29% 38% 21% 4% 2040s 1% 4% 19% 38% 29% 9% 2080s 1% 5% 15% 35% 28% 16%
NorWeST August Stream Temperatures Using the VIC Model - 1980
NorWeST August Stream Temperatures Using the VIC Model - 2080
Effects to Lost River Sucker and Shortnose Sucker
Upper Klamath Lake and Lost River Basin Recovery Units
increasingly limited access between lake habitats and stream spawning habitats.
Number of high flow days Stream metric Period <5 5-10 >10 Winter 95% flow 1980s 5% 95% 2040s 100% 2080s 100% m3/s <0.034 0.034-0.085 >0.085 Summer flow 1980s 8.5% 8.5% 83% 2040s 11% 8% 82% 2080s 13% 7% 80% Stream kilometers <8 8-11 11-14 14-17 17-20 >20 August temp 1980s 3% 8% 66% 23% 2040s 1% 5% 45% 49% 2080s 4% 18% 78%
Odell Lake
100% by 2080
estimated reduction in headwater summer bull trout habitat
spawning habitat
effects, reduced headwater habitat availability
Number of high flow days Stream metric Period <5 5-10 >10 Winter 95% flow 1980s 100% 2040s 11% 67% 22% 2080s 100% m3/s <0.034 0.034-0.085 >0.085 Summer flow 1980s 12% 88% 2040s 12% 10% 78% 2080s 12% 10% 78% Stream kilometers <8 8-11 11-14 14-17 17-20 >20 August temperature 1980s 85% 15% 2040s 85% 15% 2080s 85% 15%
1980s 2080s
Fish Climate Vulnerability What matters?
1) species considered 2) stream location 3) climate factor Where do vulnerabilities meet “on-the-ground”
Climate Vulnerability Could Provide a Context for Prioritizing Stream Restoration Efforts…
& Will Be Key to Improving Assessments in Future Decades…