pays we binar sc he dule
play

PAYS We binar Sc he dule Se pte mbe r 9 th T he E volution of - PowerPoint PPT Presentation

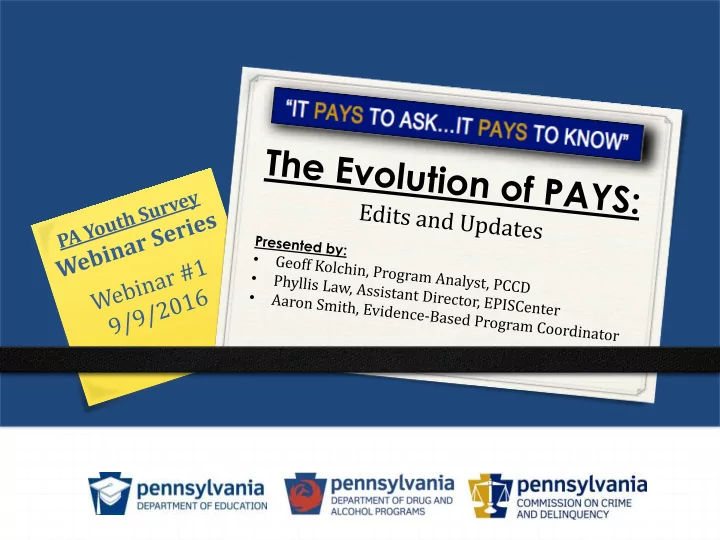
PAYS We binar Sc he dule Se pte mbe r 9 th T he E volution of PAYS Se pte mbe r 16 th E nhanc ing Your Data Analysis IQ: Advanc e d T e c hnique s to He lp T e ll Your Pr e ve ntion Stor y Se pte mbe r 23 rd 2015 PAYS


  1. PAYS We binar Sc he dule • Se pte mbe r 9 th T he E volution of PAYS • Se pte mbe r 16 th E nhanc ing Your Data Analysis IQ: Advanc e d T e c hnique s to He lp T e ll Your Pr e ve ntion Stor y • Se pte mbe r 23 rd 2015 PAYS State Re por t: T r e nds and Highlights • Se pte mbe r 30 th F ighting the Opioid E pide mic thr ough Pr e ve ntion 2

  2. T opic s Cove r e d T oday • History a nd Administra tion Ove rvie w • Va lidity Che c ks • Compa rison L e ve ls • Re port L a yout & Compa risons • Risk & Prote c tive F a c tors • PAYS Ana lysis Online T ool a nd Workbook/ Guide • T ips for Communic a ting Your PAYS Da ta 3

  3. Histor y & Administr ation Ove r vie w 4

  4. Histor y & Ove r vie w of PAYS PAYS adopted from the Communities That Care & The Generation at Risk  and was developed by Drs. J. David Hawkins & Richard Catelano at the University of WA • PAYS assesses youth behaviors, attitudes, and knowledge Students in grades 6 th , 8 th , 10 th , and 12 th grades   Primary source of information about what our youth know, think and believe about anti-social behaviors • Collects data across multiple domains that impact students’ lives Community  Family  School  Peer-Individual  • Survey is anonymous and confidential No individual student information can be obtained from the data set  Must have more than 25 responses in a grade to be included in report  5

  5. 2015 PAYS Administr ation Ove r vie w 13 th bi-annual voluntary survey conducted in schools every other year since 1989 • Administered in the Fall of 2015 to almost 230, 000 youth with 217,000 valid surveys • 960 schools 70.4% participation rate statewide  356 school districts participated in 2015; up from 342 in 2013 • 37 “other” schools (charter, parochial, private, etc.) participated down from 81 in 2013 • Over 450 reports were issued to school districts and counties • 55 counties have a report (meaning 2 or more school districts participated) • Only 4 counties with no participation at all: Sullivan, Union, Wayne, & Wyoming • 20% increase in online administration of the survey = approx. 60K students • 6

  6. 2015 PAYS Administr ation Ove r vie w • Refined questions/responses – Changes found on pages 108-109 Gambling   Sources for obtaining alcohol & prescription drugs  School violence Bullying  ATOD Use  Housing Transition  Abuse  Grief  Involvement in After-School Activities  Included breakdown for Risk Factors • Commitment to school  Favorable Attitudes Toward Drug Use  7

  7. State wide Validity Che c k In 2013, 7.3% surveys were removed statewide In 2015, 5.6% surveys were removed statewide Anything less than 10% considered valid 8

  8. L e ve ls of Compar ison State National Yellow Triangle on chart Black Dot on chart   Placed on charts in 2013 Placed on charts in 2013   70.4% participation rate state-wide  • Bach Harrison Norm Description on Page 10 & 91  Helps communities to compare data to  County national/state results Understanding Cut-Points  Local reports will not have county data   RPF defined by percentage of youth at risk Will have a county report when 2 or or protected from risk  more school districts participated • Monitoring the Future 55 county reports available  Description on Page 9  Report layout is identical to local reports  Survey administered through  University of Michigan Surveillance data: ATOD usage  www.pays.pa.gov 9

  9. State & National Compar isons 10

  10. PAYS L oc al/ County Re por t L ayout • Each subtopic includes introduction section  Overview/definition of topic  Data highlight and lowlights  Survey questions relating to section • Graphical and tabular results display on the same page  Graphs include comparison of state and National/Bach Harrison Norm (as applicable) Layout for results • Graphical (on top) and tabular (at bottom)  Where data was available, 2011 & 2013 results included  Always note the scale that is used for each chart – is it 30%, 50% or 100%? • • Lifetime and 30-day use are printed “back-to-back” for ease of reproduction 11

  11. Appe ndic e s A – D • Appendix A: DFC Data  PAYS has been approved by SAMHSA to report Core Measures • Appendix B: Survey Methodology  3-Form Design: A, B, C  Changes • Appendix C: For more information  Excellent source for additional information and data gathering  Another great source for archival data collection is: www.episcenter.psu.edu/dataresources • Appendix D: Participating School District(s)  The county reports will have all participating schools districts listed  Non-traditional/parochial schools will be listed as a school district o 37 charter/parochial schools participated and each received some type of analysis o SCA got choose which/and if non-traditional schools were included 12

  12. Risk and Pr ote c tive F ac tor s 13

  13. Se c tion 7: Risk & Pr ote c tive F ac tor s (RPF s) • Based on the public health model of reducing risk by increasing protection  i.e. heart disease • Fall into 1 of 4 domains  Community Section Highlights  Family Definitions •  School Grade-Level Analysis •  Peer-Individual RPF Profiles • Understanding Cut-Points • • Youth Behaviors Affected by RPFs  Substance Use  Delinquency  Teen Pregnancy  School Drop-Out  Violence  Depression & Anxiety 14

  14. RPF Ove r vie w • Important to analyze RPFs by GRADE LEVEL  Total scores can be misleading most notably with RPFs  Need to be able to pinpoint issues to best identify programs that you need • Total RPF State Data not included in reports  Grade-level state data included in graphs & charts  Total state data provided as an additional handout • Theoretical Framework  PAYS uses a refined & targeted subset of risk factors  Every check mark represents a minimum of 2 longitudinal studies  Not as many connections for Depression & Anxiety because not enough time to study 15

  15. RPF T he or e tic al F r ame wor k 16

  16. Pe nnsylvania RPF Ove r vie w • 21 Risk Factors linked to following behaviors: Note: There were 20 in 2013 – Gang Involvement returned in 2015  Substance Use  Teen Pregnancy  Violence  Delinquency  School Drop-Out  Depression & Anxiety • 8 Protective Factors  Exert a positive influence over risk factors  Also known as “assets”  Social Development Model – the 5-facet foundation of Protective Factors o Help youth bond by helping them SOAR: providing them with skills, opportunities & rewards leads them to following healthy beliefs & clear standards 17

  17. Pe nnsylvania RPF Analysis • Percentage of kids who are at risk OR are with protection at each level  School District  County (if available)  State  Nation – Based on all data collected by Bach-Harrison across the country on similar measures • Total Risk & Total Protection  Total Risk = 5 or more risk factors for grades 6 & 8 and 7 or more for grades 10 & 12  Total Protection = 3 or more protective factors in grades 6, 8, 10, & 12 18

  18. Risk Factors Statewide Totals 42% of PA youth report • being at risk for Low Neighborhood Attachment 46% of PA youth report • being at risk for Parental Attitudes Favorable Toward Antisocial Behavior 46% of PA youth report • being at risk for Perceived Risk of Drug Use 19

  19. Protective Factors Statewide Totals 63% of PA youth report • being protected against risk by having strong Family Attachment 62% of PA youth report • being protected against risk by having Family Opportunities for Prosocial Involvement 62% of PA youth report • being protected against risk by having Family Rewards for Prosocial Involvement 20

  20. T ips for Communic ating Your PAYS Data 21

  21. Your PAYS T oolbox • Visit www.PAYS.pa.gov for your PAYS Toolbox:  Statewide Summary Report  County-Level Reports (for 55 counties)  PAYS User Guide and Worksheets  PAYS Online Data Analysis Tool  PAYS Survey Instrument available  Fact Sheets about PAYS for various audiences  PAYS FAQ  And other great information! 22

  22. How c an you be st analyze your PAYS data? • Visit www.PAYS.pa.gov to access your PAYS Toolbox The P e Pen ennsylvania Yo Youth S Survey ey ( (PAYS YS) 2015 2015 User Guide and Worksheets for School Professionals • Download and use the PAYS Guide & Worksheets to analyze your data www www.epis iscenter.org/p /paysguide “IT PAYS TO ASK…IT PAYS TO KNOW” • Order special report for specific data sets • Reach out to local “experts” from The EPISCenter represents a collaborative partnership between the Pennsylvania Commission on Crime and Delinquency (PCCD), and the your SCA, coalitions, school board, Prevention Research Center, College of Health and Human Development, Penn State University. The EPISCenter is funded by PCCD and the Department of Public Welfare. This resource was developed by the EPISCenter through PCCD grant VP-ST-24368. etc… • Reach out EPISCenter & local experts for assistance 23

  23. L e t’s Answe r Your Que stions! 24

Download Presentation
Download Policy: The content available on the website is offered to you 'AS IS' for your personal information and use only. It cannot be commercialized, licensed, or distributed on other websites without prior consent from the author. To download a presentation, simply click this link. If you encounter any difficulties during the download process, it's possible that the publisher has removed the file from their server.

Recommend


More recommend