
SLIDE 1
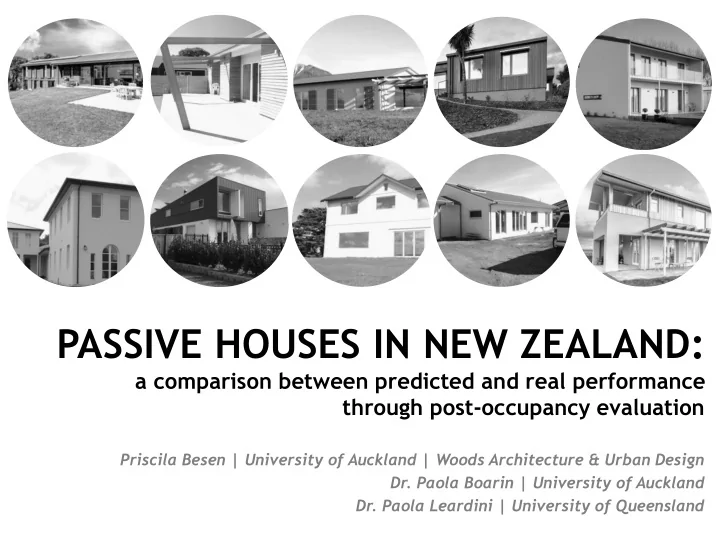
PASSIVE HOUSES IN NEW ZEALAND:
a comparison between predicted and real performance through post-occupancy evaluation
Priscila Besen | University of Auckland | Woods Architecture & Urban Design
- Dr. Paola Boarin | University of Auckland
- Dr. Paola Leardini | University of Queensland