
SLIDE 1
Department of City Planning |Transportation Division | August 2011
| Parking CORE Study Department of City Planning |Transportation - - PowerPoint PPT Presentation
MN | Parking CORE Study Department of City Planning |Transportation Division | August 2011 POLICY BACKGROUND 1970: The Clean Air Act becomes law, requiring all states to adopt a federally- enforceable State Implementation Plan (SIP) to
Department of City Planning |Transportation Division | August 2011
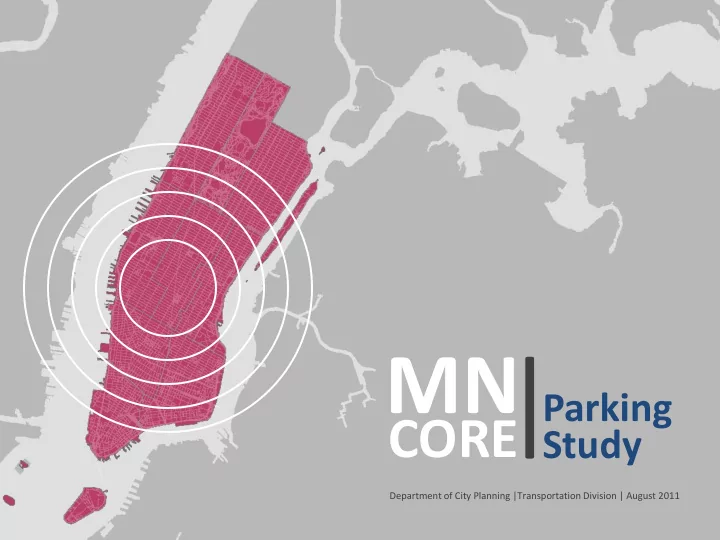
MANHATTAN CORE
Public Parking Survey NYC Department of City Planning Transportation Division
2
POLICY BACKGROUND
1970: The Clean Air Act becomes law, requiring all states to adopt a federally- enforceable State Implementation Plan (SIP) to indicate how they will comply with national air quality standards. 1973: NYC adopts a Transportation Control Plan with several measures intended to reduce automobile use, including a goal of reducing off-street parking in the Central Business District (CBD) by 40%. 1977: Federal court order instructs the City to implement a parking management strategy in the CBD. 1982: Manhattan Core parking regulations (Article I, Chapter 3 in the ZR) are adopted, with the primary goal of reducing auto use by limiting commuter parking. Since 1982: Air quality in Manhattan has improved and the City has achieved compliance with carbon monoxide standards. This is mostly due to reformulated gasoline and improvements in vehicle pollution controls.
MANHATTAN CORE
Public Parking Survey NYC Department of City Planning Transportation Division
3
Maximum as-of-right residential parking spaces permitted, as a percentage of dwelling units 35% max 20% max
Removed parking requirements for most residential developments, replaced with parking maximums New parking in existing buildings no longer allowed as-of-right, only by City Planning Commission action Accessory parking permitted (not required) up to maximum amount based on use and size of development:
Surface parking lots no longer allowed as-of- right in commuter areas: Midtown, Lower Manhattan, part of West Side
1982 MANHATTAN CORE PARKING REGULATIONS
* Excludes portions of the
Hudson Yards area
MANHATTAN CORE
Public Parking Survey NYC Department of City Planning Transportation Division
EFFECTS OF PARKING POLICIES: TRAFFIC AND PARKING
between 1978 and 2009
Between 1999 and 2009, the number of hub-bound vehicles decreased by 11 percent but remains above the 1982 number.
4 100,000 200,000 300,000 400,000 500,000 600,000 700,000 800,000 900,000 1975 1980 1985 1990 1995 2000 2005 2010 Hub-Bound Vehicles DCA Spaces Linear (DCA Spaces)
127,000 105,000 649,000 750,347 689,000 844,000
MANHATTAN CORE
Public Parking Survey NYC Department of City Planning Transportation Division
5
DEMOGRAPHICS: JOURNEY TO WORK
15% n=211,430 68% n=964,418 17% n=248,744
MODE OF TRANSPORTATION TO WORK: ALL MANHATTAN RESIDENT WORKERS 2006-2008 ACS n=1,424,592
Auto Transit Other means 15% n=345,853 73%
n=1,684,611
12% n=275,549
MODE OF TRANSPORTATION TO WORK: ALL WORKERS IN MANHATTAN 2006-2008 ACS n=2,306,013
Auto Transit Other Means
Source: ACS 2006-2008
MANHATTAN CORE
Public Parking Survey NYC Department of City Planning Transportation Division
6 61% 39%
MANHATTAN POPULATION INCREASE, 1980 to 2006-2008 MANHATTAN VEHICLE AVAILABILITY INCREASE, 1980 to 2006-2008
MN Core study area (Increase in population = 120,243) Manhattan Non-Core (Increase in population = 75,697) MN Core study area (Increase in households with vehicles available = 26,059) Manhattan Non-Core (Increase in households with vehicles available = 12,258)
Source: NYC DCP Socioeconomic Profiles of Population and Housing: 1980 Census; ACS PUMS 2006-2008
68% 32%
DEMOGRAPHICS: POPULATION AND VEHICLE AVAILABILITY
vehicle availability than Non-Core residents (61 percent of population increase, and 68 percent of vehicle availability increase occurred in Core).
MANHATTAN CORE
Public Parking Survey NYC Department of City Planning Transportation Division
DEMOGRAPHICS: MANHATTAN CORE HOUSEHOLD VEHICLE
OWNERSHIP BY FAMILY STATUS (1990 & 2006-2008)
7
+4% +1%
Source: Census 1990 and ACS 2006-2008 Full Sample
rate (42%) as families without children (20%).
60% 58% 79% 80% 40% 42% 21% 20% 0% 10% 20% 30% 40% 50% 60% 70% 80% 90% 100% 1990 (n=66,461) 2006-2008 (n=80,177) 1990 (n=345,394) 2006-2008 (n=448,024) Households with Children Households without Children
HOUSEHOLD VEHICLE OWNERSHIP BY FAMILY STATUS Do not own a vehicle Own vehicle
MANHATTAN CORE
Public Parking Survey NYC Department of City Planning Transportation Division
DEMOGRAPHICS: VEHICLE REGISTRATIONS
8
despite the 1982 policy to reduce parking.
50,000 100,000 150,000 200,000 250,000 1978 1979 1980 1981 1982 1983 1984 1985 1986 1987 1988 1989 1990 1991 1992 1993 1994 1995 1996 1997 1998 1999 2000 2001 2002 2003 2004 2005 2006 2007 2008 2009
Manhattan Vehicle Registrations
MANHATTAN CORE
Public Parking Survey NYC Department of City Planning Transportation Division
9
DEMOGRAPHICS: INCOME
Source: ACS 2009
18% 30% 24% 28%
Income Distribution of Households in Manhattan Core, 2009 (n=542,534)
Less than $24,911 $24,911-$80,960 $80,961-$161,921 $161,922 or more
MANHATTAN CORE
Public Parking Survey NYC Department of City Planning Transportation Division
DEMOGRAPHICS: INCOME
10
93%
(71,933)
86%
(108,625)
78%
(106,687)
64%
(119,579)
91% 85% 74% 59% 9% 15% 26% 41%
0% 10% 20% 30% 40% 50% 60% 70% 80% 90% 100%
Less than $24,911 $24,911-$80,960 $80,961-$161,921 $161,922 or more
Percent of Households in the Manhattan Core with Vehicles by Household Income, 2009
Households with vehicle (n=131,228) Households with no vehicle (n=411,306)
(n=94,029) (n=163,313) (n=131,937) (n=153,255)
Source: ACS 2009
MANHATTAN CORE
Public Parking Survey NYC Department of City Planning Transportation Division 11
OVERVIEW: 2009 MANHATTAN CORE PARKING SURVEY
Purpose: To better understand how the existing supply of off-street public parking in the Manhattan Core is used, and by whom Intercept survey of individual users at 110 public parking garages in the Manhattan Core. Collected 2,871 surveys, approx. 16% of all DCA-licensed spaces in the Core 12 questions: purpose of trip, where do you live, how long did you park for, why did you choose this location, why didn’t you use transit Limitations:
residential parkers
downturn Surveyed weekdays 1-3 pm and 4-6 pm and subset of facilities Friday nights 9-11 pm
MANHATTAN CORE
Public Parking Survey NYC Department of City Planning Transportation Division
12
SURVEY FINDINGS: ORIGIN OF USERS
respondents lived in the same ZIP code.
MANHATTAN CORE
Public Parking Survey NYC Department of City Planning Transportation Division 10.2% 4.1% 15.9% 13.1% 11.9% 11.4% 8.1% 15.6% 24.7% 12.2% 8.1% 5.9% 11.3% 13.8% 8.0% 10.5% 25.2% 25.0% 7.1% 15.1% 15.1% 8.8% 22.2% 25.0% 14.0% 14.2% 14.4% 14.1% 9.9% 18.0% 5.1% 13.8% 18.8% 35.4% 38.8% 27.2% 28.2% 39.7% 15.6% 40.5% 31.2% 35.1% 27.8% 30.7% 5.5% 8.4% 12.1% 19.0% 10.8% 8.0% 6.3% 9.3% 17.1% 13.5% 10.8% 20.9% 12.3% 17.0% 17.3% 12.6% 25.6% 10.1% 18.9% 2.8% 17.7% 22.7% 0% 10% 20% 30% 40% 50% 60% 70% 80% 90% 100%
Parking Location by Place of Origin (n=1,300)
CDs 7 and 8 CD 6 CD 5 CD 4 CDs 2 and 3 CD 1 13
SURVEY FINDINGS: ORIGIN OF USERS
locations in CD1.
facilities.
MANHATTAN CORE
Public Parking Survey NYC Department of City Planning Transportation Division
14
SURVEY FINDINGS: TRIP PURPOSE (USER GROUPS)
MANHATTAN CORE
Public Parking Survey NYC Department of City Planning Transportation Division
15
SURVEY FINDINGS: Destination of Users
14.8% 3.8% 13.5% 7.4% 11.1% 17.4% 27.6% 13.5% 14.4% 22.0% 7.0% 15.7% 34.1% 45.3% 2.5% 17.9% 11.5% 3.6% 8.6% 16.4% 14.2% 7.9% 40.8% 29.0%
0% 10% 20% 30% 40% 50% 60% 70% 80% 90% 100% Commuting/Business (n=881) Entertainment/Shopping (n=160) Residential Monthly (n=82) All Other (n=193)
Garage Location by Trip Purpose (n=1,317)
CDs 7 & 8 CD 6 CD 5 CD 4 CDs 2 & 3 CD 1
MANHATTAN CORE
Public Parking Survey NYC Department of City Planning Transportation Division
16
SURVEY FINDINGS: Occupation of Users
sales occupations.
5.4%
28.1% 24.1% 24.9%
0.4% 5.2% 1.0% 7.7% 0.3% 0.5% 1.2% 1.5% 5.5% 2.9% 3.1% 4.4% 2.5% 2.9% 0.0% 0.4%
14.1% 9.6% 9.4% 10.4% 32.9% 32.8% 37.3% 26.0% 24.4% 15.2% 23.5% 20.2% 14.5% 2.8% 0.4% 4.5% 0% 10% 20% 30% 40% 50% 60% 70% 80% 90% 100% Commuting/ Business (n=851) Entertainment/ Shopping (n=155) Residential Monthly (n=81) All Other (n=180)
Occupation (n=1,267)
Construction/Maintenance Management/Executive Professional/Technical Sales Secretarial/Clerical/Administrative Services Transportation/Materials Moving Student Other (including homemaker, not employed, or retired)
MANHATTAN CORE
Public Parking Survey NYC Department of City Planning Transportation Division
SURVEY FINDINGS: TIME OF DAY SURVEYED
17 1% 35% 1% 1% 57% 34% 53% 45% 41% 32% 45% 54%
0% 10% 20% 30% 40% 50% 60% 70% 80% 90% 100%
Commuting/Business (n=2008) Entertainment/Shopping (n=351) Residential Monthly (n=123) Other (n=389)
Percent
Time Surveyed (n=1,316)
1-3 pm 4-6 pm 9-11 pm (Friday)
largest percentage traveling on Friday evenings.
frequency during peak hours.
MANHATTAN CORE
Public Parking Survey NYC Department of City Planning Transportation Division
SURVEY FINDINGS: WHO PAID FOR PARKING
18 43.9% 4.6% 7.9% 8.0% 54.6% 92.4% 92.1% 88.1% 1.5% 3.0% 0.0% 3.9% Commuting/Business (n=872) Entertainment/Shopping (n=158) Residential Monthly (n=82) All Other (n=189)
Who Paid for Parking (n=1,301)
Employer/Client Paid or Subsidized I Paid Other Paid or Subsidized
an employer or client.
pay for their own parking.
MANHATTAN CORE
Public Parking Survey NYC Department of City Planning Transportation Division
SURVEY FINDINGS: VEHICLE OCCUPANCY
19 78% 17% 60% 51% 18% 48% 23% 37% 5% 35% 17% 12%
Commuting/Business (n=858) Entertainment/Shopping (n=156) Residential Monthly (n=78) All Other (n=179)
Vehicle Occupancy (n=1,271)
1 2 3+
most likely to travel in large groups.
MANHATTAN CORE
Public Parking Survey NYC Department of City Planning Transportation Division
20
SURVEY FINDINGS: REASONS FOR NOT TAKING TRANSIT
35% 13% 8% 19% 13% 8% 7% 2% 2% 24% 19% 0% 5% 10% 15% 20% 25% 30% 35% 40% Transit Schedule Transit Stops Transit Transfers Need Car for Work Multiple Stops Carrying Packages Passengers Parking Cost Subsidized Carpool Comfort Other Percent Reasons Note: This is a “check all that apply” question
(n=1,305)
MANHATTAN CORE
Public Parking Survey NYC Department of City Planning Transportation Division
21
SURVEY FINDINGS: REASONS FOR NOT TAKING TRANSIT
share of respondents who said they need their car for work were employed in construction and sales.
16% 24% 30% 20% 10%
Need Car For Work by Occupation (n=248)
Construction/Maintenance (n=39) Management/Executive (n=58) Professional/Technical (n=72) Sales (n=49) All Other Occupations (n=29)
MANHATTAN CORE
Public Parking Survey NYC Department of City Planning Transportation Division
22
SURVEY FINDINGS: REASONS FOR NOT TAKING TRANSIT
25% 20% 18% 21% 8% 10% 9% 11% 5% 6% 3% 6% 16% 4% 11% 5% 8% 11% 7% 8% 6% 3% 10% 5% 3% 10% 9% 8% 2% 1% 0% 1% 1% 1% 1% 1% 15% 25% 8% 18% 12% 10% 23% 15% 0% 5% 10% 15% 20% 25% 30% Commuting/Business (n=875) Entertainment/Shopping (n=159) Residential Monthly (n=80) All Other (n=191) Percent
Reasons for Not Taking Transit (n=1,305)
Transit Schedule Transit Stops Transit Transfers Need Car For Work Multiple Stops Carrying Packages Passengers Parking Cost Subsidized Carpool Comfort Other
for work as reasons for not taking transit.
taking transit.
not taking transit.
MANHATTAN CORE
Public Parking Survey NYC Department of City Planning Transportation Division
SURVEY FINDINGS: NUMBER OF VEHICLE TRIPS IN LAST
MONTH FOR MANHATTAN RESIDENTS
23 40% (n=32) 36% (n=29) 24% (n=19)
Residential Monthly Parkers: Number of Times Used Car in the Past Month (n=80)
20 or more 5 to 19 Less than 5
times in the prior month.
driving 20 times or more in the prior month.
62% (n=66) 21% (n=23) 17% (n=18)
Manhattan Residents: Number of Vehicle Trips in the Past Month (n = 107)
20 or more 5 to 19 Less than 5
MANHATTAN CORE
Public Parking Survey NYC Department of City Planning Transportation Division
24
SURVEY FINDINGS: NUMBER OF VEHICLE TRIPS IN LAST
MONTH FOR NON-MANHATTAN RESIDENTS
past month, but only 32 percent did so by motor vehicle.
commuters.
32% (n =330) 31% (n=324) 37% (n=385)
Non-Residents: Number of Vehicle Trips to Manhattan in the Past Month (n =1,039)
20 or more trips 5-19 trips Less than 5 trips 45% (n=480) 27% (n=288) 28% (n=292)
Non-Residents: Number of Trips to Manhattan in the Past Month – Including All Modes (n=1,060)
20 or more trips 5-19 trips Less than 5 trips
MANHATTAN CORE
Public Parking Survey NYC Department of City Planning Transportation Division
25
SURVEY FINDINGS: NUMBER OF VEHICLE TRIPS IN LAST MONTH
less than five times in the prior month.
40% making 20 or more trips.
40% 6% 12% 34% 14% 33% 27% 80% 55% 0.00% 10.00% 20.00% 30.00% 40.00% 50.00% 60.00% 70.00% 80.00% 90.00% Commuting/Business (n=746) Entertainment/ Shopping (n=129) All Other (n=144)
Non-Manhattan Residents: Number of Vehicle Trips into Manhattan in the Past Month (n=989)
20 or more 5 to 19 Less than 5
MANHATTAN CORE
Public Parking Survey NYC Department of City Planning Transportation Division
MN CORE SURVEY DATA: REASON FOR PARKING IN A FACILITY
50% .3% 50% 1% 49% 24% 9% 4% 2% 6% 4%
% 20% 40% 60% 80% 100% 120% MN Monthly Residents (n = 123) All Other Respondents (n = 2,744) Percent
Other Medical/Dental Appt Visiting Family or Friends Shopping Entertainment Business-Related Work Store Car Here-Live Elsewhere Store Car Here-Live in the Bldg ALL OTHER RESPONDENTS 26
(n = 2,867)
lived in the building.
MN RESIDENTIAL MONTHLY PARKERS
MANHATTAN CORE
Public Parking Survey NYC Department of City Planning Transportation Division
MN RESIDENTS: OPERATOR-PROVIDED DATA
were leased to MN residential monthly parkers in the Core.
to MN residential monthly parkers (over 70% in CDs 2&3 and CDs 7&8).
27
MANHATTAN CORE
Public Parking Survey NYC Department of City Planning Transportation Division
28
use buildings were leased to MN residential monthly parkers. The highest percentages were in CDs 2&3 and 7&8.
69% 44% 24% 30% 67% 42% 44% 72% 50% 44% 41% 74% 48% 60% 0% 20% 40% 60% 80% CDs 7&8 (n = 21) CD 6 (n = 11) CD 5 (n = 28) CD 4 (n = 15) CDs 2&3 (n = 13) CD 1 (n = 9) CDs 1-8 (n = 97) Percent CD Residential or Mixed Use All Land Uses Source: Operator-Provided Data
OPERATOR-PROVIDED DATA: PERCENT OF SPACES LEASED TO MN RESIDENTIAL MONTHLY PARKERS
MANHATTAN CORE
Public Parking Survey NYC Department of City Planning Transportation Division
MN RESIDENTS: DOF MN RESIDENTIAL PARKING TAX EXEMPTION
and register a motor vehicle to a MN address and store their vehicle in a long-term facility to receive a discounted parking tax rate.
(n = 3,907 DOF filers; 17% of surveyed DCA capacity)
residents than previously thought.
parking facility.
29
MANHATTAN CORE
Public Parking Survey NYC Department of City Planning Transportation Division
DOF MN RESIDENT PARKING TAX EXEMPTION
RESIDENTS WHO LIVE WHERE THEY PARK, BY RESIDENT CD
CD Number of Surveyed Facilities Live Where they Park Total % Live Where Park 101 10 34 435 7.8% 102 14 61 646 9.4% 103 4 136 0.0% 104 18 24 351 6.8% 105 31 29 280 10.4% 106 11 26 372 7.0% 107 7 7 750 0.9% 108 15 216 928 23.3% 109-112 N/A 9 0.0% Total 110 397 3,907 10%
30
they parked their vehicles.
MANHATTAN CORE
Public Parking Survey NYC Department of City Planning Transportation Division
DOF MN RESIDENT PARKING TAX EXEMPTION
31
DISTANCE TRAVELED FROM RESIDENCE TO PARKING FACILITY, BY RESIDENT CD
CD Number of Surveyed Facilities In same Building or Less than .25 Miles % .25 to .49 Miles % .5 to 2 Miles % More than 2 Miles % Total 101 10 250 57.50% 147 33.80% 28 6.40% 10 2.30% 435 102 14 502 77.70% 96 14.90% 34 5.30% 14 2.20% 646 103 4 57 41.90% 49 36.00% 20 14.70% 10 7.40% 136 104 18 249 70.90% 64 18.20% 34 9.70% 4 1.10% 351 105 31 203 72.50% 43 15.40% 29 10.40% 5 1.80% 280 106 11 278 74.70% 55 14.80% 31 8.30% 8 2.20% 372 107 7 256 34.10% 198 26.40% 233 31.10% 63 8.40% 750 108 15 677 73.00% 142 15.30% 71 7.70% 38 4.10% 928 109-112 N/A 0.00% 0.00% 1 11.11% 8 88.89% 9 Total 2,472 63% 794 20% 481 12% 160 4% 3,907
a quarter mile of the facility where they parked their vehicles.
MANHATTAN CORE
Public Parking Survey NYC Department of City Planning Transportation Division
SUMMARY OF SURVEY RESULTS
32
The share of public parking in the Manhattan Core used by residents has increased dramatically since 1982. Demographic changes among Manhattan residents have led to an increase in the number of private vehicles in the Core (though this trend may have leveled
While parking plays an important role in supporting economic activity in the Core, some drivers may be flexible in their use of vehicles. Moderate constraints on parking supply may help induce some portion of this group to use transit instead. Over the last decade, there has been a significant shift from private vehicles to transit among people traveling into the Manhattan CBD, especially among commuters. Public parking in the Core frequently serves a large group of residents in the surrounding neighborhood, not just in the building.