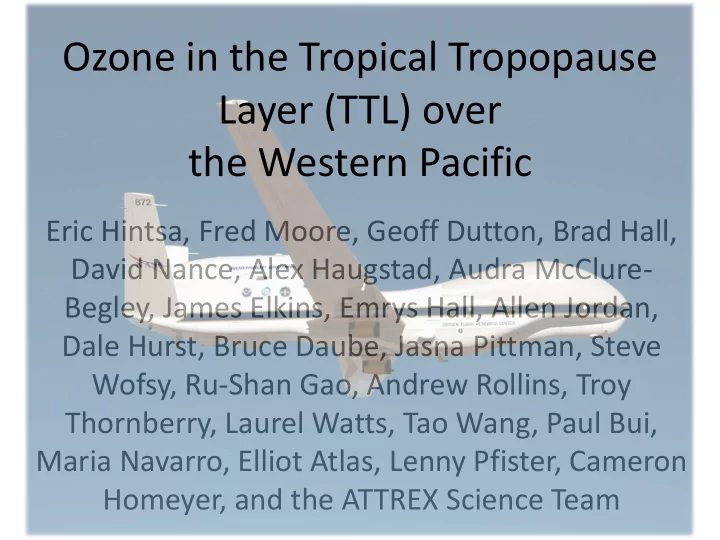

Ozone in the Tropical Tropopause Layer (TTL) over the Western Pacific Eric Hintsa, Fred Moore, Geoff Dutton, Brad Hall, David Nance, Alex Haugstad, Audra McClure- Begley, James Elkins, Emrys Hall, Allen Jordan, Dale Hurst, Bruce Daube, Jasna Pittman, Steve Wofsy, Ru-Shan Gao, Andrew Rollins, Troy Thornberry, Laurel Watts, Tao Wang, Paul Bui, Maria Navarro, Elliot Atlas, Lenny Pfister, Cameron Homeyer, and the ATTREX Science Team
ATTREX – Airborne Tropical TRopopause EXperiment, 2011-2014 • Western tropical Pacific is a major entry point of air into stratosphere • ATTREX-3 based in Guam (14°N, 145°E); 3 aircraft + balloon launches, Jan-March 2014 Global Hawk flights 13-19 km (entire TTL) • • GV (CONTRAST) and BAe-146 (CAST) at lower altitudes; coverage from surface to 19 km
Background • Low ozone has been previously observed over the tropical Pacific Ocean (Kley et al., 1996; reanalysis by Vömel and Diaz, 2010; Takashima et al., 2007, 2008 – sonde profiles). • This has been hypothesized to lead to an “OH hole”, which could more easily allow short- lived ozone depleting substances to reach the stratosphere (Rex et al., 2014; Gao et al., 2014).
ATTREX Global Hawk Payload Ozone from NOAA/CSD photometer (ATTREX-1 and 2 only) and UCATS 2B photometers (±5 ppb uncertainty in TTL). Tracers from UCATS (N 2 O, SF 6 , CH 4 , CO), Harvard University Picarro (CH 4 , CO, CO 2 ), University of Miami Whole Air Sampler (Organic bromine). Meteorological data from MMS. Ozone, CO and Whole Air Sampler on GV. Back trajectory and convection calculations.
ATTREX-3, February 17, 2014 sonde launch at Guam Global Hawk landing closest in time to sonde descent
ATTREX-3 Flight Tracks, 2014
ATTREX-3 Ozone, February 12, 2014
Combined ATTREX and CONTRAST data Gulfstream V Aircraft 8
Back Trajectories – ERA Interim met fields Trajectory end points at 13°N, 148°E, 13.7-16 km
Time since convection, Feb. 12, 2014 (L. Pfister) Most convection 5-10 days previous Convection at locations far to west of Guam Back Trajectory End Points
Local Guam flight, February 16, 2014 Long-lived tracers peak just below tropopause Ozone and tracers nearly constant at 17-18 km TTL
ATTREX-3 Ozone, March 6, 2014 Much lower ozone; often 10-20 ppb in lower TTL Ozone increases sharply at tropopause
Time since convection, March 6, 2014 Lots of recent convection Local convection and over central equatorial Pacific
March 6, 2014 Back Trajectories End points at 6°N, 144-155°E, 14.4-17 km
ATTREX-3 Ozone, March 2014 (five flights) Histogram at each altitude, black line = mean Ozone in lower TTL 10-20 ppb
ATTREX-2 and 3 tropical ozone Lowest ozone over western Pacific in March 2014 Higher in upper trop. in February 2014, and central Pacific Highest ozone over eastern Pacific
Organic Bromine – CONTRAST/ATTREX Plot and data from Elliot Atlas/WAS Total Organic Bromine = Halons + CH 3 Br + VSL Organic Br VSL = CHBr 3 , CH 2 Br 2 , CH 2 BrCl, CHBr 2 Cl, CHBrCl 2 (τ = weeks-months)
Summary • Ozone was lower in ATTREX-3, particularly in March 2014 (~20 ppb), compared to ATTREX-1 and 2. Lower ozone over the western tropical Pacific than the eastern tropical Pacific. • Tracers and back trajectory calculations consistent with deep convection into the TTL, bringing air with low ozone up to the tropopause. • Organic bromine begins to decline (and ozone increases) above 16 km, which is also the approximate highest altitude influenced by recent convection. • Understanding OH chemistry in the western tropical Pacific requires a dedicated mission.
ATTREX-2, all science flights Merged and averaged data from both 2B instruments vs. NOAA CSD ozone
ATTREX-3 Satellite Comparison AURA Satellite • MLS uncertainty overlaps UCATS ozone data – Large error bars – ~3 km vert. resolution – UCATS lower than MLS • March vs. February – Ozone lower in TTL – Higher in stratosphere 21
March 4, 2014; 18-19°N
Recommend
More recommend