
11/15/2017 1
Dmitri B. Papkovsky
School of Biochemistry and Cell Biology, University College Cork, Ireland Biological Roles of O2 and principles of
quenched-phosphorescence O2 sensing
Demonstration in in vivo studies Demonstration in ex-vivo models 3D tissue models and physiological studies in
vitro
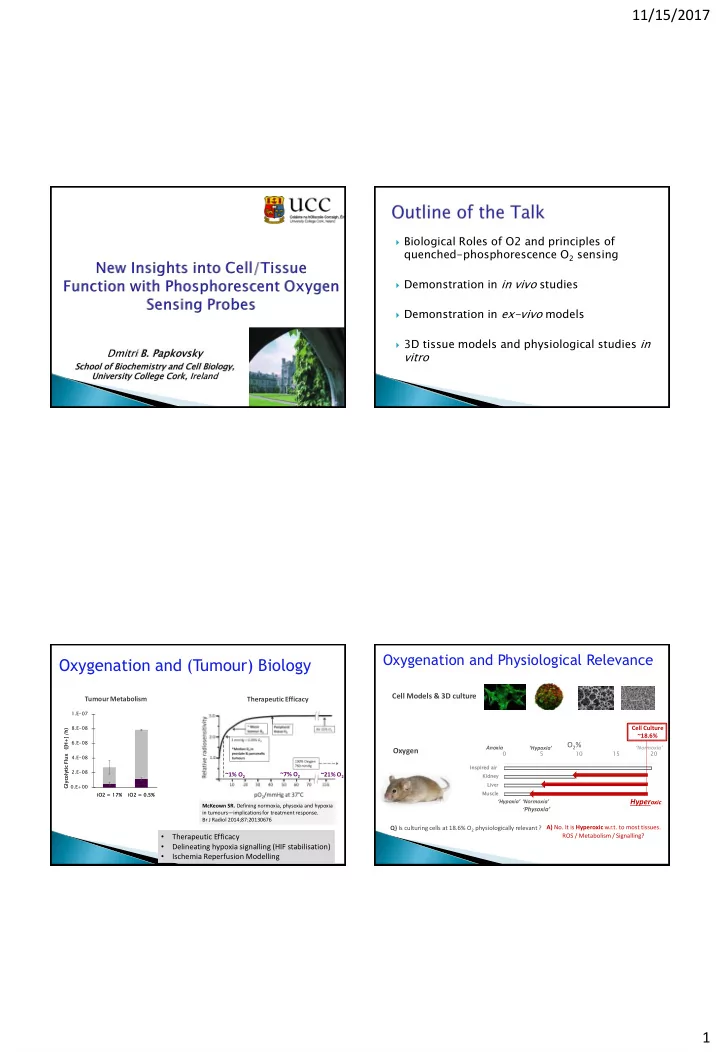
Tumour Metabolism
Oxygenation and (Tumour) Biology
McKeown SR. Defining normoxia, physoxia and hypoxia in tumours—implicationsfor treatmentresponse. Br J Radiol 2014;87:20130676
Therapeutic Efficacy
~7% O2 ~21% O2 ~1% O2
- Therapeutic Efficacy
- Delineating hypoxia signalling (HIF stabilisation)
- Ischemia Reperfusion Modelling
0.E+00 2.E-08 4.E-08 6.E-08 8.E-08 1.E-07 iO2 2 = 17% 7% iO2 2 = 0.5% Glycolytic Flux ([H+] /h)
Oxygenation and Physiological Relevance
5 10 15 20
Inspired air Kidney Liver Muscle
Cell Models & 3D culture
‘Normoxia’
Hyperoxic Oxygen
Q) Is culturing cells at 18.6% O2 physiologically relevant ? A) No. It is Hyperoxic w.r.t. to most tissues. Cell Culture ~18.6% ROS / Metabolism / Signalling?
‘Hypoxia’ ‘Hypoxia’ ‘Normoxia’
O2%
Anoxia ‘Physoxia’