
SLIDE 1
ST STAC P Pre rese sentatio ion
Annapoli lis, MD MD Jun une 201 201 7
14:1
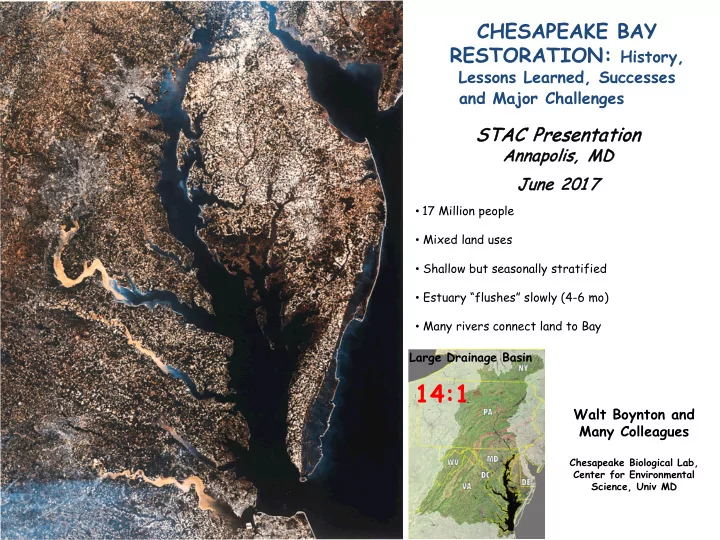
- 17 Million people
- Mixed land uses
- Shallow but seasonally stratified
- Estuary “flushes” slowly (4-6 mo)
- Many rivers connect land to Bay
Large Drainage Basin
Walt Boynton and Many Colleagues
Chesapeake Biological Lab, Center for Environmental Science, Univ MD
CHESAPEAKE BAY RESTORATION: History,
Lessons Learned, Successes and Major Challenges