outcomes from the first year
play

OUTCOMES FROM THE FIRST YEAR Medicaid Addiction and Recovery - PDF document

OUTCOMES FROM THE FIRST YEAR Medicaid Addiction and Recovery Treatment Services (ARTS) Presentation to Joint Commission on Health Care Katherine Neuhausen, MD, MPH, Chief Medical Officer Tammy Whitlock, Deputy Director of Complex Care


  1. OUTCOMES FROM THE FIRST YEAR Medicaid Addiction and Recovery Treatment Services (ARTS) Presentation to Joint Commission on Health Care Katherine Neuhausen, MD, MPH, Chief Medical Officer Tammy Whitlock, Deputy Director of Complex Care Department of Medical Assistance Service September 2018 
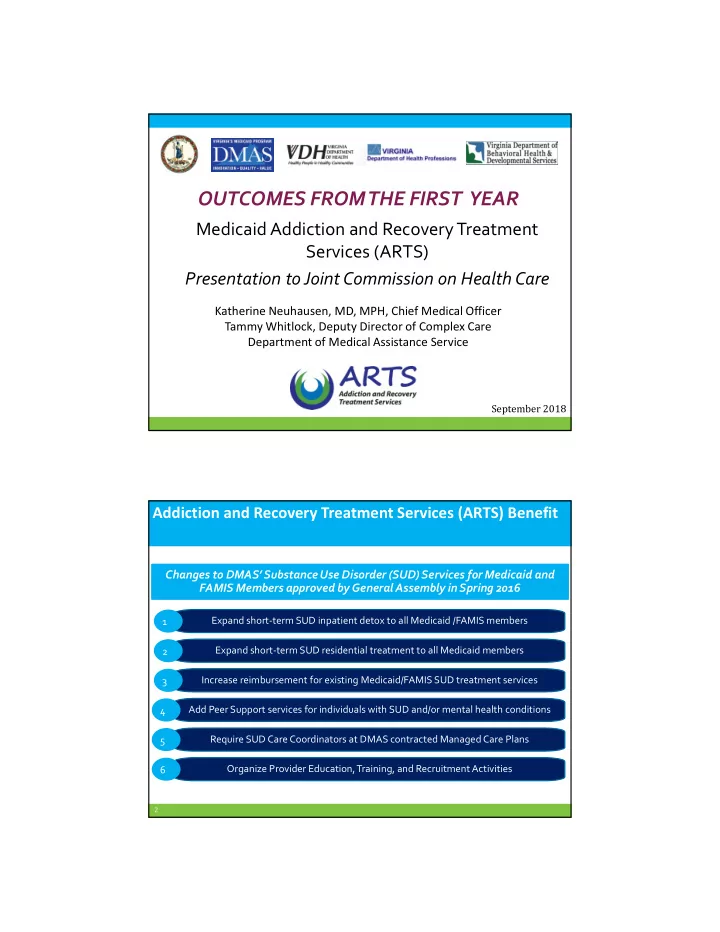
Addiction and Recovery Treatment Services (ARTS) Benefit Changes to DMAS’ Substance Use Disorder (SUD) Services for Medicaid and FAMIS Members approved by General Assembly in Spring 2016 Expand short-term SUD inpatient detox to all Medicaid /FAMIS members 1 Expand short-term SUD residential treatment to all Medicaid members 2 Increase reimbursement for existing Medicaid/FAMIS SUD treatment services 3 Add Peer Support services for individuals with SUD and/or mental health conditions 4 Require SUD Care Coordinators at DMAS contracted Managed Care Plans 5 Organize Provider Education, Training, and Recruitment Activities 6 2

  2. General Fund Appropriation for ARTS Benefit State FY GF NGF Total SFY 2017 $2.6 million $2.6 million $5.2 million SFY 2018 $8.4 million $8.4 million $16.8 million 3 Addiction and Recovery Treatment Services (ARTS): Addiction and Recovery Treatment Services (ARTS): Transforming the Delivery System of Medicaid SUD Services Transforming the Delivery System of Medicaid SUD Services • All ARTS services are covered by managed care plans • Magellan continues to cover community-based substance use disorder treatment services for fee-for-service members Intensive Opioid Outpatient Treatment Programs Program Office-Based Partial Opioid Hospitalization Treatment Residential Case Treatment Management Peer Recovery Inpatient Detox Supports Effective July 1, 2017 Effective April 1, 2017 ARTS creates a fully integrated physical and behavioral health continuum of care 4

  3. SUD Transformation 1115 Demonstration Waiver Approved by CMS in December 2016 • Allows Virginia to draw down federal matching funds for IMDs – SUD residential treatment facilities > 16 beds • Resulted in significant increase in number and size of SUD residential treatment facilities • Requires Virginia to implement national American Society of Addiction Medicine (ASAM) to create evidence-based continuum of addiction treatment • Requires robust independent waiver evaluation – partnering with Virginia Commonwealth University 5 American Society of Addiction Medicine (ASAM) Continuum 6

  4. Preferred Office-Based Opioid Treatment (OBOT) Provider – Preferred Office-Based Opioid Treatment (OBOT) Provider – Interdisciplinary Care Team Interdisciplinary Care Team Required Core Team Members • Member • Buprenorphine-waivered practitioner (physician, NP or PA) • Licensed credentialed addiction treatment professionals (e.g., LCSW, LPC, licensed clinical psychologist, etc.) • Nurse Optional Team Members • Pharmacists • Peer Recovery Specialists • Substance Use Care Coordination • This can be designated team member whose only function is to perform care coordination or a team member such as the nurse or LCSW who performs dual roles in the clinic. 7 Increases in Addiction Providers Due to ARTS Increases in Addiction Providers Due to ARTS Over 440 new Addiction Treatment Provider Sites in Medicaid Addiction Provider Type # of Providers # of Providers % Increase in before ARTS after ARTS Providers Inpatient Detox Unknown 103 NEW (ASAM 4.0) Residential Treatment 4 94 ↑ 2250% (ASAM 3.1, 3.3, 3.5, 3.7) Partial Hospitalization 0 16 NEW Program (ASAM 2.5) Intensive Outpatient Program 49 136 ↑178% (ASAM 2.1) Opioid Treatment Program 6 39 ↑ 550% Preferred Office-Based 0 89 NEW Opioid Treatment Provider 8

  5. VCU Evaluation: Outcomes from First Year of ARTS VCU Evaluation: Outcomes from First Year of ARTS Characteristics of Members • More than 20,000 members have Opioid Use Disorder (OUD) • About 30,000 members have other Substance Use Disorder including Alcohol Use Disorder and other legal/illegal drugs • OUD diagnoses increased by 15% during first year • 2/3 members with OUD are female • Members with OUD are disproportionately white and ages 45 and older and more likely to have gained eligibility as an adult with a disability 9 VCU Evaluation: Outcomes From First Year of ARTS VCU Evaluation: Outcomes From First Year of ARTS More Medicaid members are receiving treatment for all Substance Use Disorders (SUD) and Opioid Use Disorder (OUD) After ARTS Before ARTS % Change (Apr 2017-Mar 2018) (Apr 2016-Mar 2017) Members with ↑ 57% SUD receiving treatment 15,703 24,615 Members with ↑ 48% OUD receiving treatment 10,092 14,917 10

  6. VCU Evaluation: Outcomes from First Year of ARTS VCU Evaluation: Outcomes from First Year of ARTS ARTS Increased SUD Treatment in All Regions 11 VCU Evaluation: Outcomes From First Year of ARTS VCU Evaluation: Outcomes From First Year of ARTS Increase in total number of Substance Use Disorder Outpatient Providers After ARTS Before ARTS % Change (Apr 2016-Mar 2017) (Apr 2017-Mar 2018 ) Total number of ↑173% 1,087 2,965 SUD Outpatient Providers ↑502% Physicians 261 1,571 By Provider Type ↑652% 25 NP 188 ↑52% Counselors and SW 300 457 ↑50% 501 749 Other 12

  7. VCU Evaluation: Outcomes From First Year of ARTS VCU Evaluation: Outcomes From First Year of ARTS Increase in total number of Opioid Use Disorder Outpatient Providers Before ARTS After ARTS % Change (Apr 2016-Mar 2017) (Apr 2017-Mar 2018) Total number of ↑137% 570 1,352 OUD Outpatient Providers ↑358% Physicians 128 586 By Provider Type ↑408% NP 13 66 ↑66% Counselors and SW 142 236 ↑62% 287 464 Other 13 VCU Evaluation: Outcomes From First Ten Months of ARTS VCU Evaluation: Outcomes From First Ten Months of ARTS Fewer Emergency Department visits related to Substance Use Disorder (SUD) and Opioid Use Disorder (SUD) Before ARTS After ARTS % Change (Apr 2016-Jan 2017) (Apr 2017-Jan 2018) ED Visits Related ↓ 14% to SUD 24,962 21,445 ED Visits Related ↓ 25% to OUD 5,016 3,756 2 14

  8. VCU Evaluation: Outcomes From First Ten Months of ARTS VCU Evaluation: Outcomes From First Ten Months of ARTS Fewer inpatient hospitalizations related to Substance Use Disorder (SUD) and Opioid Use Disorder (SUD) Before ARTS After ARTS % Change (Apr 2016-Jan 2017) (Apr 2017-Jan 2018) Hospitalizations ↓ 4% Related to SUD 13,182 12,650 Hospitalizations ↓ 6% Related to OUD 3,520 3,315 2 15 VCU Evaluation: Decrease in ED Visits Due to ARTS Program VCU Evaluation: Decrease in ED Visits Due to ARTS Program Probability of an Emergency Department Visit 40.0% Without 35.0% ARTS Members with OUD 30.0% 25.0% 20.0% Members without SUD 15.0% 10.0% 5.0% 0.0% Q1 Q2 Q3 Q4 Q1 Q2 Q3 Q4 ARTS 16

  9. VCU Evaluation: Decrease in Inpatient Hospitalizations Due VCU Evaluation: Decrease in Inpatient Hospitalizations Due to ARTS Program to ARTS Program Probability of an acute inpatient hospitalization 30.0% Without 25.0% ARTS Members with OUD 20.0% 15.0% 10.0% 5.0% Members without SUD 0.0% Q1 Q2 Q3 Q4 Q1 Q2 Q3 Q4 ARTS 17 VCU Evaluation: Outcomes From First Year of ARTS VCU Evaluation: Outcomes From First Year of ARTS Decrease in total number of prescriptions and members with prescriptions for opioid pain medications After ARTS Before ARTS (Apr 2017-Mar 2018 ) % Change (Apr 2016-Mar 2017) Total number of prescriptions for ↓ 27% opioid pain medications 399,678 549,442 Number of members who ↓ 17% received prescriptions 137,847 115,096 18

  10. Implementation of CDC Guideline for Prescribing Opioids Implementation of CDC Guideline for Prescribing Opioids for Chronic Pain (FFS) for Chronic Pain (FFS) Decrease in Opioid Pills, Cost & Days Supply 300,000 265,715 Implementation of CDC Guidelines in FFS 250,000 CCC Plus Implementation – 200,000 FFS Members in LTC transitioned to MCO Reductions 150,000 59% Quantity 51% Payment $122,594 58% Days Supply 100,000 57,728 50,000 $36,564 61,020 14,917 0 _____Quantity (# pills) _____Payment ______Days Supply 19 Implementation of CDC Guideline for Prescribing Opioids Implementation of CDC Guideline for Prescribing Opioids for Chronic Pain (MCO) for Chronic Pain (MCO) Decrease in Opioid Pills, Cost & Days Supply 3,000,000 Implementation of CDC Guidelines in MCOs “new starts only” 2,500,000 2,648,760 CDC Guidelines Applied to All Members 2,000,000 Reductions 54% quantity 51% payment 1,500,000 54% days supply $1,409,573 1,210,766 1,000,000 $699,241 500,000 665,619 308,055 0 _____Quantity (# pills) _____Payment ______Days Supply 20

Download Presentation
Download Policy: The content available on the website is offered to you 'AS IS' for your personal information and use only. It cannot be commercialized, licensed, or distributed on other websites without prior consent from the author. To download a presentation, simply click this link. If you encounter any difficulties during the download process, it's possible that the publisher has removed the file from their server.

Recommend


More recommend