... Other types of activation functions ( net = w i x i ) x n w n - - PDF document

other types of activation functions net w i x i x n w n 1
SMART_READER_LITE
LIVE PREVIEW

... Other types of activation functions ( net = w i x i ) x n w n - - PDF document

M otivation Knowledge discovery process FEATURE SELECTION USING Interpretation ANT COLONY OPTIM IZATION: M odeling Knowledge APPLICATIONS IN HEALTH CARE Feature selection Patterns Preprocessing Reduced data Joo M . C. Sousa 1 Data


slide-1
SLIDE 1

1 FEATURE SELECTION USING ANT COLONY OPTIM IZATION: APPLICATIONS IN HEALTH CARE

João M . C. Sousa1

jmsousa@ist.utl.pt

  • S. M . Vieira1, S. N. Finkelstein2,3, A. S. Fialho1,2,

F . Cismondi1,2, S. R. Reti3 and M . D. Howell3

1 Technical University of Lisbon, Instituto Superior Técnico, Dept. of Mechanical Engineering,

CIS/IDMEC – LAETA, Av. Rovisco Pais, 1049-001 Lisbon, Portugal

2 Massachusetts Institute of Technology, Engineering Systems Division, 77 Massachusetts

Avenue, 02139 Cambridge, MA, USA

3 Division of Clinical Informatics, Department of Medicine, Beth Israel Deaconess Medical

Centre, Harvard Medical School, Boston, MA, USA
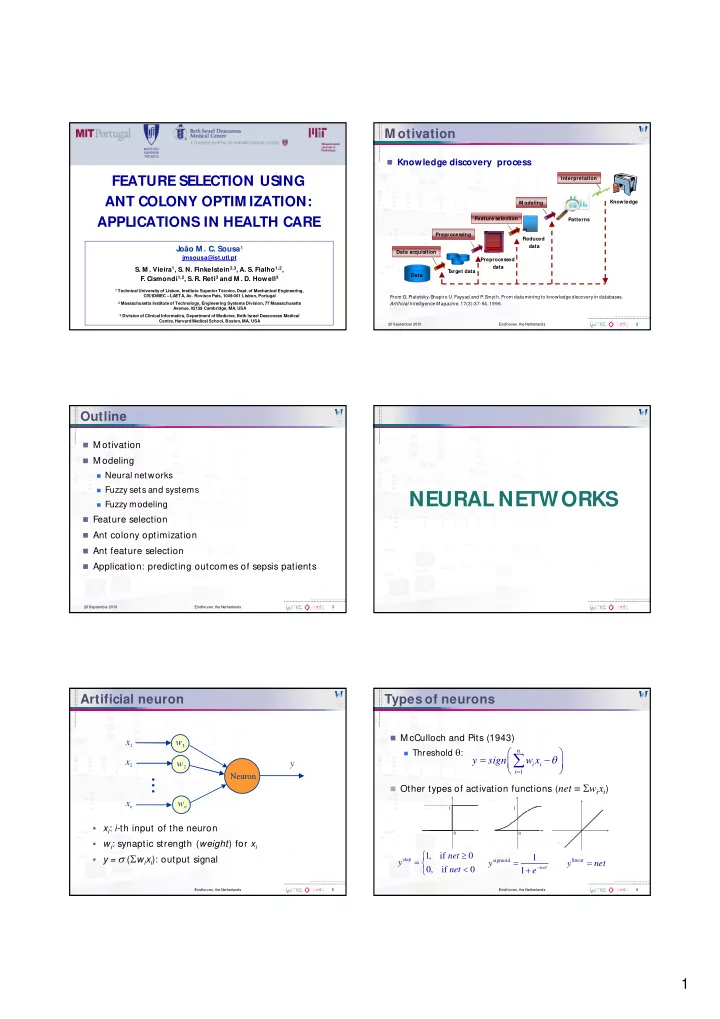
M otivation

Knowledge discovery process

20 September 2010 Eindhoven, the Netherlands 2

M odeling Data T arget data Preprocessed data Reduced data Patterns Knowledge Data acquisition Preprocessing Feature selection Interpretation From G. Piatetsky-Shapiro U. Fayyad and P . Smyth. From data mining to knowledge discovery in databases. Artificial Intelligence Magazine, 17(3):37-54, 1996.

Outline

M otivation M odeling

Neural networks Fuzzy sets and systems Fuzzy modeling

Feature selection Ant colony optimization Ant feature selection Application: predicting outcomes of sepsis patients

20 September 2010 Eindhoven, the Netherlands 3

NEURAL NETWORKS

Eindhoven, the Netherlands 5

Artificial neuron

xi: i-th input of the neuron wi: synaptic strength (weight) for xi y = (wixi): output signal

w2 wn x1 x2 xn

...

y

Neuron

Eindhoven, the Netherlands 6

Types of neurons

M cCulloch and Pits (1943)

Threshold : 1

  • n

i i i

y sign w x

  • Other types of activation functions (net = wixi)

1 1

step

1, if 0, if

  • net

y net

sigmoid

1 1

  • net

y e

linear

y net

slide-2
SLIDE 2

2

Eindhoven, the Netherlands 7

M ulti-Layer Perceptron (M LP)

Can learn functions that are not linearly separable.

Output signals

Eindhoven, the Netherlands 8

M ost common M LP

Output layer Hidden layer

x1 xi xn

... ...

1 2 j m

wij

h

1 k l

w11

h

wnm

h

w11

  • y1

yk yl

... ... ... ...

wjk

  • b1

h

bm

h

b1

  • bl
  • wml
  • Eindhoven, the Netherlands

9

M ost common M LP

  • Output of neurons in the hidden-layer hj:
  • 1

tanh

n n h h h j ij i j ij i i i n h ij i i

h w x b w x w x

  • Output of neurons in the output-layer yk:
  • 1

m m

  • k

jk j j jk k j j m

  • jk

j j

y w h b w h w h

  • sigmoid

linear

Eindhoven, the Netherlands 10

Learning in NN

Biological neural networks:

Synaptic connections amongst neurons which

simultaneously exhibit high activity are strengthned.

Artificial neural networks:

M athematical approximation of biological learning. Error minimization (nonlinear optimization problem).

Error backpropagation (first-order gradient) Newton methods (second-order gradient) Levenberg-M arquardt (second-order gradient) Conjugate gradients ...

Eindhoven, the Netherlands 11

Supervised learning

Training data:

1 2 T T T T N

  • Y

y y y

  • 1

2 T T T T N

  • X

x x x

  • x

y e

Eindhoven, the Netherlands 12

Bibliography

S

. Haykin. Neural Networks - A Comprehensive

  • Foundation. Prentice Hall, 1999.

J.-S. Jang, C.-T. Sun and E. M izutani. Neuro-Fuzzy and

Soft Computing: A Computational Approach to Learning and Machine Intelligence. Prentice Hall, New Jersey, 1997.

Andries P. Engelbrecht. Computational Intelligence: An

  • Introduction. John Wiley, Chichester, 2002

M ichael Negnevitsky. Artificial Intelligence: A Guide to

Intelligent Systems. Addison-Wesley, Pearson Education, 2002.

slide-3
SLIDE 3

3

FUZZY SETS

Basic Concepts

Eindhoven, the Netherlands 14

Introduction

  • How to simplify very complex systems?
  • Allow some degree of uncertainty in their

description!

  • How to deal mathematically with uncertainty?
  • Using probabilistic theory (stochastic).
  • Using the theory of fuzzy sets (non-stochastic).
  • Proposed in 1965 by Lotfi Zadeh (Fuzzy Sets,

Information Control, 8, pp. 338-353).

  • Imprecision or vagueness in natural language does

not imply a loss of accuracy or meaningfulness!

Eindhoven, the Netherlands 15

Classical set

Example: set of old people A = {age | age 70}

A

50 60 70 80 90 100 0.5 1

16

Logic propositions

“Nick is old” ... true or false Nick’s age:

ageNick = 70, A(70) = 1 (true) ageNick = 69.9, A(69.9) = 0 (false)

A

50 60 70 80 90 100 0.5 1

Eindhoven, the Netherlands 17

Fuzzy set

Graded membership, element belongs to a set to a

certain degree.

A

50 60 70 80 90 100 0.5 1

membership grade

18

Fuzzy proposition

“Nick is old”... degree of truth

ageNick = 70,

A(70) = 0.5

ageNick = 69.9, A(69.9) = 0.49 ageNick = 90,

A(90) = 1

A

50 60 70 80 90 100 0.5 1

membership grade

slide-4
SLIDE 4

4

Eindhoven, the Netherlands 19

Typical linguistic values

20 40 60 80 100 1

membership grade

young middle age

  • ld

20

Linguistic variable

x is age = {young, middle age, old}

20 40 60 80 100 1

membership grade

young middle age

  • ld

semantic rules MX

Eindhoven, the Netherlands 21

Fuzzy complement

(x) = 1 – A(x)

1

x

  • A

Eindhoven, the Netherlands 22

Intersection of fuzzy sets

AB(x) = min(A(x),B(x))

x

  • B

A

Eindhoven, the Netherlands 23

Union of fuzzy sets

AB(x) = max(A(x),B(x))

x

  • B

A

FUZZY SYSTEM S

slide-5
SLIDE 5

5

Eindhoven, the Netherlands 25

Linguistic variable

{x, , , M X}

Where: x – name of the linguistic variable – linguistic values (terms) – Universe of discourse M X – semantic rule that associates each linguistic

value to a membership function.

Eindhoven, the Netherlands 26

Fuzzy if-then rules

Fuzzy propositions

x is A, y is B

Linguistic (M amdani) fuzzy if-then rule:

If x is A then y is B

Antecedent: x is A Consequent: y is B

Rule “ If x is A then y is B” is represented by a

fuzzy relation defined on X Y.

Eindhoven, the Netherlands 27

Examples

If the road is slippery then brake softly. If error is Negative big and e is Positive big then u is

Negative small.

If a tomato is red then the tomato is ripe. If the temperature is very high then reduce the heat a

lot.

If the valve is closed then the pressure is high.

Eindhoven, the Netherlands 28

Linguistic (M amdani) model

Decomposing using conjunctive forms:

: is is , 1,2, ,

k k k

R A B k K

  • If x

then y

  • 1

1 2 2 1 1 2 2

: is is is is is is

k k k k n n k k k p p

R x A x A x A y B y B y B If and and and then and and and

  • Degree of fulfillment of antecedents:

1 2

1 2

= ( ) ( ) ( ), 1,2, ,

k k k n

k n A A A

x x x k K

  • Eindhoven, the Netherlands

29

Takagi-Sugeno fuzzy model

Affine linear form:

: is ( ), 1,2, ,

k k k k

R A y f k K

  • If x

then x

  • :

is

T k k k k k

R A y a b

  • If x

then x

Degree of fulfillment k defined as in linguistic models M odel output given by the weighted fuzzy-mean:

  • 1

1 1 1

( )

K K k k T k k k k k K K j j j j

a b y y

  • x

Eindhoven, the Netherlands 30

Bibliography

  • G. Klir and T. Folger. Fuzzy S

ets Uncertainty and Information. Prentice Hall, 1988.

J.-S. Jang, C.-T. Sun and E. Mizutani. Neuro-Fuzzy and S

  • ft

Computing: A Computational Approach to Learning and Machine Intelligence. Prentice Hall, New Jersey, 1997.

Andries P. Engelbrecht. Computational Intelligence: An

  • Introduction. John Wiley, Chichester, 2002.

J.M.C. Sousa and U. Kaymak. Fuzzy Decision Making in Modeling

and Control. World Scientific Series in Robotics and Intelligent Systems, vol. 27. World Scientific Pub. Co., Singapore, Dec. 2002

Michael Negnevitsky. Artificial Intelligence: A Guide to

Intelligent S

  • ystems. Addison-Wesley, Pearson Education, 2002.
  • R. Babuska. Fuzzy Modeling for Control. Kluwer Academic

Publishers, 1998.

slide-6
SLIDE 6

6

FUZZY M ODELING

Eindhoven, the Netherlands 32

Kernel-based modeling

Fuzzy systems Radial basis function networks Support vector machines M ulti-layer perceptron ... Fuzzy systems can be interpretable! Fuzzy sets can close the gap between symbolic

processing and numerical computations.

Eindhoven, the Netherlands 33

Fuzzy system parameters

Parameters of antecedent membership functions

(shape, location, etc.)

Parameters of consequent membership functions

(M amdani systems)

Parameters of consequent functions (Takagi-S

ugeno systems)

Aggregation of antecedent memberships Implication/ reasoning Defuzzification function (M amdani systems)

Eindhoven, the Netherlands 34

Building fuzzy models

  • Data-driven approach
  • nonlinear mapping
  • extract from input-output data:
  • rules
  • antecedents (membership functions)
  • consequents (membership or crisp functions)

35

Fuzzy c-means

0.5 1 0.5 1 0.5 1 X Y MF 0.5 1 0.5 1 0.5 1 X Y MF 0.5 1 0.5 1 0.5 1 X Y MF

Assumes partition matrix is fixed

Eindhoven, the Netherlands 36

M odeling based on fuzzy clustering

1. Collect the data 2. S elect model structure (M amdani, Takagi-S ugeno,… ) 3. S elect number of clusters and clustering algorithm 4. Cluster the data 5. Obtain antecedent membership functions (M F) from

  • clusters. Obtain consequents (M F or parameters)

6. Determine a fuzzy rule for each cluster 7. S implify the model, if necessary 8. Validate the model

slide-7
SLIDE 7

7

Eindhoven, the Netherlands 37

Building fuzzy models

Structure

Input and output variables. For dynamic systems also

the representation of the dynamics.

Number of membership functions per variable, type of

membership functions, number of rules.

Parameters

Antecedent membership functions Consequent parameters

Eindhoven, the Netherlands 38

Linguistic models from clustering

Use fuzzy c-means algorithm. Cluster data in input–output product space. M embership functions obtained by:

projection onto variables, membership function parameterization.

One rule per cluster

: is is , 1,2, ,

k k k

R A B k K

  • If x

then y

  • Figure reproduced with permission of Prof. Uzay Kaymak

39

Example of linguistic model

If income is Low then tax is Low If income is High then tax isHigh

Eindhoven, the Netherlands 40

Selecting number of antecedents

A priori knowledge (experts, dynamics, etc.) Regularity criterion – based on cross-validation.

S

plit training set randomly into two parts (A and B)

M inimize regularity criterion: Variables selected incrementally until regularity

criterion increases.

  • 2

2 1 1 1 2 1 1

ˆ ˆ

  • A

B A B

k k A AB B BA i i i i k k i i

RC y y y y

Eindhoven, the Netherlands 41

Selecting number of antecedents

Feature selection (FS)

Principal Component Analysis (PCA) Curvilinear Component Analysis (CCA) (...) Tree search methods

Bottom-up Top-down

FS

using genetic algorithms

FS using ant colony optimization

FEATURE SELECTION

slide-8
SLIDE 8

8

Introduction

M any applications have hundreds to tens of thousands

  • f variables/ features

M any are irrelevant and/ or redundant. Curse of dimensionality.

20 September 2010 Eindhoven, the Netherlands 43 Eindhoven, the Netherlands 44

Feature selection

What is feature selection?

Remove features (inputs) X(i) to improve (or least degrade) prediction of outputs Y.

Advantages:

Feature selection selects most relevant features Collect/ process less features and data Less complex models run faster Models are easier to understand, verify and explain

Eindhoven, the Netherlands 45

Feature selection algorithms

Filters

Based on general characteristics of data to be evaluated. No model is involved.

Wrappers

Uses model performance to evaluate feature subsets. Train one classification model for each feature subset.

Hybrid methods

Do not retrain the model at every step. Search feature selection space and model parameter

space simultaneously.

Tree search – bottom-up

20 September 2010 Eindhoven, the Netherlands 46

ANT COLONY OPTIM IZATION

Eindhoven, the Netherlands 48

Biologically inspired algorithms

Artificial ant colonies: maybe the most used method

from the artificial life algorithms.

Introduced by M arco Dorigo (1992), has been well

received by academic world and it is starting to be used in industrial applications.

Applications: Traveling S

alesman Problem, Vehicle Routing, Quadratic Assignment Problem, Internet Routing, Logistic S cheduling, clustering and data mining problems.

slide-9
SLIDE 9

9

Eindhoven, the Netherlands 49

Ant Colony Optimization

Artificial Life algorithms: swarm, ants, wasps, bees Ant Colony Optimization is one of the most used

method of the Artificial Life algorithms.

Applications:Travelling salesman problem, vehicle

routing, quadratic assignment problem, internet routing, logistics scheduling.

There are also some applications of ACO in clustering

and data mining problems, including feature selection.

Eindhoven, the Netherlands 50

What is special about ants?

Ants can perform complex tasks:

nest building, food storage garbage collection, war foraging (to wander in search of food)

There is no management in an ant colony

collective intelligence

They communicate using:

pheromones (chemical substance), sound, touch

Curiosities:

Ant colonies exist for more than 100 million years M yrmercologists estimate that there are around 20 000 species

  • f ants

Eindhoven, the Netherlands 51

The foraging behaviour of ants

  • How can almost blind animals manage to learn the shortest route paths

from their nests to the food source and back?

a) - Antsfollow path between the Nest and the Food Source b) - Ants go around the obstacle following one

  • f two different paths with equal

probability c) - On the shorter path, more pheromonesare laid down Fotos: http:/ / iridia.ulb.ac.be/ ~mdorigo/ ACO/ RealAnts.html d) – At the end, all ants follow the shortest path.

52

Artificial ants

Artificial ants move in graphs

nodes / arcs environment is discrete

As real ants:

choose paths based on pheromone

concentration

deposit pheromones on paths Environment updates pheromones

Extra abilities of artificial ants:

prior knowledge (heuristic) memory (feasible neighbourhood N

Eindhoven, the Netherlands 53

M athematical framework

Choose node Initialization Set ij = 0 For l =1: Nmax Build a complete tour For i = 1 to n For k = 1 to m Choose node Update N Apply local heuristic end end Analyze solutions For k = 1 to m Compute fk end Update pheromones end Update feasible neighbourhood Pheromone update

, if ( , ) 0, otherwise

k ij

Q f i j S

  • \

N N j

  • k

ij

l l

  • )

1 ( ) ( ) 1 (

, 0, otherwise

ij ij k ij ij ij j

if j N p

  • 54

Bibliography

M arco Dorigo and Thomas Stützle. Ant Colony

  • Optimization. The M IT Press. July 2004.
  • J. Kennedy, R. C. Eberhart and Y. Shi. Swarm
  • Intelligence. M organ Kaufmann Publishers, 2002.

Andries P. Engelbrecht. Computational Intelligence: An

  • Introduction. John Wiley, Chichester, 2002
slide-10
SLIDE 10

10

ANT FEATURE SELECTION

Objective function

Objectives:

minimize the number of misclassifications, or the

classification error Ne

reduce the number of features, or the feature

cardinality Nf

  • Tradeoff precision vs. accuracy.

20 September 2010 Eindhoven, the Netherlands 56

  • 1

2

minimize

e f

f N w w N

M ulticriteria ant system

20 September 2010 Eindhoven, the Netherlands 57 Feature 1 Feature N

Rank Features Ytest Xtest

Test Cost

M odeling

Ant system

Ant colony for selection

  • f features

Ant colony for cardinality

  • f features

Update pheromone Update pheromone

N cycles M inimize number of features M inimize classification error

Ant Feature Selection (AFS)

20 September 2010 Eindhoven, the Netherlands 58

Choose node Pheromone update

( 1) ( )(1 )

k ij

l l

  • x3

x5 x7 x1 x2 x4 xn x6 Subset: {x3,x6,x7,x1,x4}

, 0, otherwise

ij ij k ij ij ij j

if j N p

  • Heuristics in AFS

Heuristic for feature cardinality: Fisher’s score for the

features

Heuristic for selection of features: classification error

e(i) for the individual features

20 September 2010 Eindhoven, the Netherlands 59 1 2 1 2

2 2 2

( ) ( ) ( ) ( ) ( )

c c c c

i i F i i i

  • mean and variance values of feature

i for the samples in class c1 and c2

1 ( ) ( )

f i

e i

  • Eindhoven, the Netherlands

60

Ant feature selection

General design

Number of ants g Balance of exploration and exploitation Combination with greedy heuristics or

local search

When should pheromones be updated?

slide-11
SLIDE 11

11

Eindhoven, the Netherlands 61

/ * Initialization * / Set parameters f, n, f, n, f, n, I, N, g. for t = 1 to I Choose size of subset Nf(k) for each ant k for l = 1 to N Build feature set Lk

f(t) choosing Nf(k) features

Derive model using Lk

f(t) features selected by ant k

Compute classification error E

k(t)

Update pheromone trails ni(t + 1) and fj(t + 1) end for end for

Algorithm

PREDICTING OUTCOM ES OF SEPTIC SHOCK PATIENTS

M otivation

20 September 2010 Eindhoven, the Netherlands 63

Problem

Septic shock is a common ICU key adverse

  • utcome, translated into ~50% mortality

rate and high costs of treatments. Feature Selection (tree search and ant colony optimization)

M ethods

Fuzzy Systems or Neural Networks + Feature Selection (tree search and ant colony optimization)

Goal

Predict the outcome (survive or decease)

  • f septic shock patients,

for purposes of therapy management.

Sepsis

Annual mortality rate of sepsis in USA: more than

220,000. Sepsis is the tenth most common cause of death.

S

evere sepsis accounts 2% to 3% of all hospital

  • admissions. 59% of patients with sepsis require ICU

care, composing 10.4% of ICU admissions.

The mortality rate for severe sepsis ranges from 13%

to 50%, and is as high as 80% to 90% for septic shock and multiple organ dysfunction.

20 September 2010 Eindhoven, the Netherlands 64

Septic shock - background

M anagement of sepsis is increasingly protocol-driven Care is goal-directed and parameterized With goal-directed therapy, care becomes similar to a

control problem, with ‘ideal’ process of care revolving around:

Setting a goal/ target for a specific physiological parameter Rapidly driving the physiologic process toward specific

goal/ target

Maintaining that physiological parameter within upper and

lower limits of that goal

20 September 2010 Eindhoven, the Netherlands 65

Septic shock - assumptions

Adequacy of control depends largely on:

Close monitoring Early detection of change Active management and intervention by nurses

20 September 2010 Eindhoven, the Netherlands 66

slide-12
SLIDE 12

12

M EDAN database

Database used as testbench (Paetza 2003)

http:/ / 141.2.16.103/ datenbank/ download_database.htm

Variables

The M EDAN data base contains the data of 103

variables of 387 patients

Data from ICU from 1998-2002 collected by medical

documentation staff

All patients have septic shock of abdominal cause

Task

Predict patients survival

20 September 2010 Eindhoven, the Netherlands 67

Problems in the database

20 September 2010 Eindhoven, the Netherlands 68

Selection of 387 patients and 59 variables.

Problems in the database

One of the most complete patients.

20 September 2010 Eindhoven, the Netherlands 69

Variable Time [hours]

Problems in the database

M easurements for a considerable part of the variables

stopped.

20 September 2010 Eindhoven, the Netherlands 70

Variable Time [hours]

Problems in the database

Long periods with missing data.

20 September 2010 Eindhoven, the Netherlands 71

Variable Time [hours]

Classification measures

In this example we used the following measures:

Classification accuracy (% of correct classification) Area under the ROC Curve (AUC) S

pecificity

S

ensitivity

20 September 2010 Eindhoven, the Netherlands 72

slide-13
SLIDE 13

13

Confusion matrix

20 September 2010 Eindhoven, the Netherlands 73

Specificity and Sensibility

Specificity or true negative rate (TNR) Sensitivity or true positive rate (TPR)

20 September 2010 Eindhoven, the Netherlands 74

TN Specificity TN FP

  • TP

Sensibility TP FN

  • Area Under the ROC Curve (AUC)

In signal detection theory, a receiver operating characteristic

(ROC), or simply ROC curve, is a graphical plot of the sensitivity,

  • vs. false positive ratio (1 specificity).

20 September 2010 Eindhoven, the Netherlands 75

Area under the ROC curve

(AUC)

Results

Classification accuracy ACC (%)

20 September 2010 Eindhoven, the Netherlands 76

FS

method

M odel 12 Features set 28 Features set Num. Feat. M ean Std Num. Feat. M ean Std

  • NN

[Paetza] 12 69.0 4.37

  • Tree

search Fuzzy 2-6 74.1 1.31 2-7 82.3 1.56 NN 2-8 73.2 2.03 4-8 81.2 1.97 AFS Fuzzy 2-3 72.8 1.44 3-9 78.6 1.44 NN 2-7 75.7 1.37 5-12 81.9 2.12

Results

S

pecificity

20 September 2010 Eindhoven, the Netherlands 77

FS method M odel 12 Features set 28 Features set Num. Feat. M ean Std Num. Feat. M ean Std

  • NN

[Paetza] 12 92.3

  • Tree

search Fuzzy 2-6 71.2 2.86 2-7 83.3 2.62 NN 2-8 81.7 3.61 4-8 90.3 2.05 AFS Fuzzy 2-3 70.5 0.02 3-9 78.2 0.03 NN 2-7 85.6 0.02 5-12 90.2 0.02

Results

S

ensitivity

20 September 2010 Eindhoven, the Netherlands 78

FS method M odel 12 Features set 28 Features set Num. Feat. M ean Std Num. Feat. M ean Std

  • NN

[Paetza] 12 15.0

  • Tree

search Fuzzy 2-6 79.9 2.60 2-7 82.3 1.56 NN 2-8 54.5 5.42 4-8 64.2 3.92 AFS Fuzzy 2-3 76.5 0.03 3-9 79.2 0.04 NN 2-7 59.6 0.02 5-12 67.0 0.05

slide-14
SLIDE 14

14

Results

AUC

20 September 2010 Eindhoven, the Netherlands 79

FS

method

M odel

12 Features set 28 Features set

Num. Feat. M ean Std Num. Feat. M ean Std

  • NN

[Paetza] 12

  • Tree

search Fuzzy 2-6 75.0 1.06 2-7 81.8 1.97 NN 2-8 71.9 1.17 4-8 80.8 1.28 AFS Fuzzy 2-3 73.5 0.01 3-9 78.7 0.02 NN 2-7 72.6 0.01 5-12 78.1 0.03

12 features subset

20 September 2010 Eindhoven, the Netherlands 80

0% 20% 40% 60% 80% 100% 1 2 5 6 8 10 14 16 17 24 26 28

Frequency Feature label

BU + FM AFS + FM AFS + NN BU + NN

M ost frequent features: 8 – pH 26 – Calcium 28 – Creatinine

28 features subset

20 September 2010 Eindhoven, the Netherlands 81

0% 10% 20% 30% 40% 50% 60% 70% 80% 90% 100% 1 2 3 5 6 8 9 10 11 12 13 14 16 17 18 20 22 24 25 26 28 29 31 32 35 41 43 85

Frequency Feature label

BU + FM AFS + FM AFS + NN BU + NN

M ost frequent features: 8, 26, 28 and 18 – thrombocytes 41 – CRP (C-reactive protein) 22 – antithrombin III 85 – FiO2 35 – total bilirubin

Future work

Apply the same techniques to larger health care

databases with more available features (M IM IC II)

M IM IC II (dimension of database) 40,000 patients and

500 features

Preprocessing

Large amount of missing values Uneven time samplings

Validate models with other datasets – Hospital da Luz

in Lisbon.

20 September 2010 Eindhoven, the Netherlands 82