Activation Functions Activation Functions In [1]: % matplotlib - - PowerPoint PPT Presentation

activation functions activation functions
SMART_READER_LITE
LIVE PREVIEW

Activation Functions Activation Functions In [1]: % matplotlib - - PowerPoint PPT Presentation

Activation Functions Activation Functions In [1]: % matplotlib inline import d2l from mxnet import autograd, nd def xyplot(x_vals, y_vals, name): d2l.set_figsize(figsize=(5, 2.5)) d2l.plt.plot(x_vals.asnumpy(), y_vals.asnumpy())


slide-1
SLIDE 1

Activation Functions Activation Functions

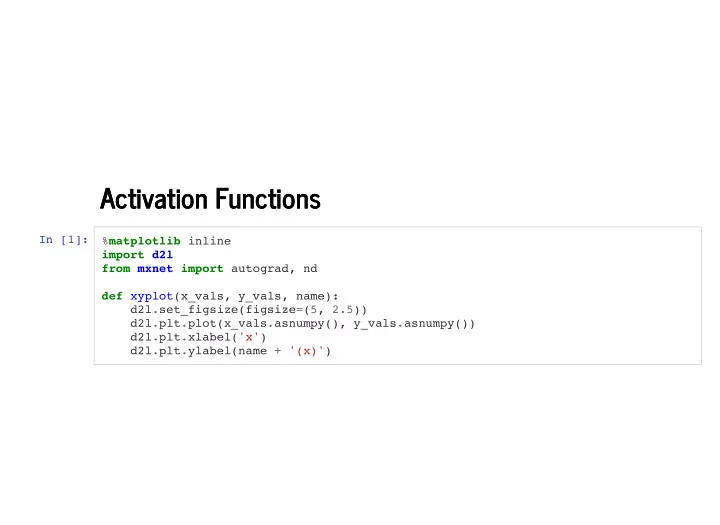
In [1]: %matplotlib inline import d2l from mxnet import autograd, nd def xyplot(x_vals, y_vals, name): d2l.set_figsize(figsize=(5, 2.5)) d2l.plt.plot(x_vals.asnumpy(), y_vals.asnumpy()) d2l.plt.xlabel('x') d2l.plt.ylabel(name + '(x)')

slide-2
SLIDE 2

ReLU Function ReLU Function

ReLU(x) = max(x, 0).

In [2]: x = nd.arange(-8.0, 8.0, 0.1) x.attach_grad() with autograd.record(): y = x.relu() xyplot(x, y, 'relu')

slide-3
SLIDE 3

The Sub-derivative of ReLU The Sub-derivative of ReLU

In [3]: y.backward() xyplot(x, x.grad, 'grad of relu')

slide-4
SLIDE 4

Sigmoid Function Sigmoid Function

sigmoid(x) = . 1 1 + exp(−x)

In [4]: with autograd.record(): y = x.sigmoid() xyplot(x, y, 'sigmoid')

slide-5
SLIDE 5

The Derivative of Sigmoid The Derivative of Sigmoid

sigmoid(x) = = sigmoid(x) (1 − sigmoid(x)) . d dx exp(−x) (1 + exp(−x))2

In [5]: y.backward() xyplot(x, x.grad, 'grad of sigmoid')

slide-6
SLIDE 6

Tanh Function Tanh Function

tanh(x) = . 1 − exp(−2x) 1 + exp(−2x)

In [6]: with autograd.record(): y = x.tanh() xyplot(x, y, 'tanh')

slide-7
SLIDE 7

The derivative of Tanh The derivative of Tanh

tanh(x) = 1 − (x). d dx tanh2

In [7]: y.backward() xyplot(x, x.grad, 'grad of tanh') In [ ]: