Orion Gold Project Locations Exploration Update: Connors Arch - - PDF document

orion gold project locations exploration update connors
SMART_READER_LITE
LIVE PREVIEW

Orion Gold Project Locations Exploration Update: Connors Arch - - PDF document

ASX Announcement / Media Release 15 July 2013 Orion Gold Project Locations Exploration Update: Connors Arch Epithermal Project Orion Gold NL (ASX: ORN ) is pleased to present the attached Exploration Update with regards to exploration activities


slide-1
SLIDE 1

ASX Announcement / Media Release 15 July 2013

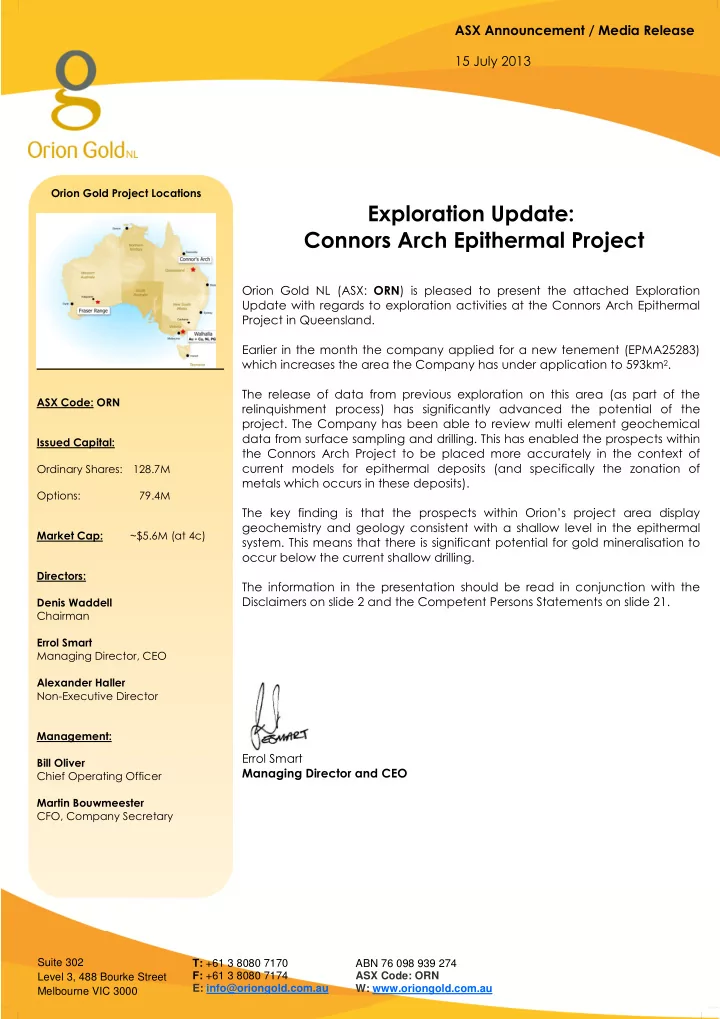
Suite 302 Level 3, 488 Bourke Street Melbourne VIC 3000 T: +61 3 8080 7170 F: +61 3 8080 7174 E: info@oriongold.com.au ABN 76 098 939 274 ASX Code: ORN W: www.oriongold.com.au Orion Gold Project Locations ASX Code: ORN Issued Capital: Ordinary Shares: 128.7M Options: 79.4M Market Cap: ~$5.6M (at 4c) Directors: Denis Waddell Chairman Errol Smart Managing Director, CEO Alexander Haller Non-Executive Director Management: Bill Oliver Chief Operating Officer Martin Bouwmeester CFO, Company Secretary

Exploration Update: Connors Arch Epithermal Project

Orion Gold NL (ASX: ORN) is pleased to present the attached Exploration Update with regards to exploration activities at the Connors Arch Epithermal Project in Queensland. Earlier in the month the company applied for a new tenement (EPMA25283) which increases the area the Company has under application to 593km2. The release of data from previous exploration on this area (as part of the relinquishment process) has significantly advanced the potential of the

  • project. The Company has been able to review multi element geochemical

data from surface sampling and drilling. This has enabled the prospects within the Connors Arch Project to be placed more accurately in the context of current models for epithermal deposits (and specifically the zonation of metals which occurs in these deposits). The key finding is that the prospects within Orion’s project area display geochemistry and geology consistent with a shallow level in the epithermal

  • system. This means that there is significant potential for gold mineralisation to
  • ccur below the current shallow drilling.

The information in the presentation should be read in conjunction with the Disclaimers on slide 2 and the Competent Persons Statements on slide 21. Errol Smart Managing Director and CEO

slide-2
SLIDE 2

1

ASX Code: ORN www.oriongold.com.au

Queensland Exploration

July 2013

slide-3
SLIDE 3

2

Disclaimer and Forward-Looking Statements

  • Certain statements contained in this presentation, including information as to the future financial or operating

performance of Orion Gold NL and its projects, are forward-looking statements. Such forward-looking statements:

  • are necessarily based upon a number of estimates and assumptions that, while considered reasonable by Orion Gold NL, are inherently

subject to significant technical, business, economic, competitive, political and social uncertainties and contingencies;

  • involve known and unknown risks and uncertainties that could cause actual events or results to differ materially from estimated or

anticipated events or results reflected in such forward-looking statements; and

  • may include, among other things, statements regarding targets, estimates and assumptions in respect of metal production and prices,
  • perating costs and results, capital expenditures, mineral reserves and mineral resources and anticipated grades and recovery rates, and

are or may be based on assumptions and estimates related to future technical, economic, market, political, social and other conditions.

  • Orion Gold NL disclaims any intent or obligation to update publicly any forward-looking statements whether as

a result of new information, future events or results or otherwise.

  • The words 'believe', 'expect', 'anticipate', 'indicate', 'contemplate', 'target', 'plan', 'intends', 'continue', 'budget',

'estimate', 'may', 'will', 'schedule' and similar expressions identify forward-looking statements.

  • All forward-looking statements made in this presentation are qualified by the foregoing cautionary statements.

Investors are cautioned that forward-looking statements are not guarantees of future performance and accordingly investors are cautioned not to put undue reliance on forward-looking statements due to the inherent uncertainty therein.

  • All information in respect of Exploration Results should be read in conjunction with the Competent Person

Statements at the end of this presentation.

slide-4
SLIDE 4

3

Epithermal Au and Porphyry Au-Cu Australia & SW Pacific

3

NEW ENGLAND FOLD BELT LACHLAN FOLD BELT

  • Epithermal and porphyry Au mineralisation styles dominantly hosted by magmatic arcs
  • Modern arcs located in settings such as the Pacific ‘Ring of Fire’ (in yellow)
  • In Eastern Australia, prospective ‘fossil’ magmatic arcs occur within the:
  • New England Fold Belt
  • Lachlan Fold Belt
slide-5
SLIDE 5

4

Area selection: New England Fold Belt, Queensland

4

  • NEFB in Queensland hosts numerous

+1Moz Devonian through to Triassic aged epithermal and intrusion-related Au deposits

  • Many of these are Permian – Carboniferous

aged systems and are intimately associated with intrusive lithologies (red) of similar age

  • Two major trends apparent in the P-C

geology;

  • Primary (arc-parallel) NW trend
  • Secondary (arc-normal) NE trend

200 km

slide-6
SLIDE 6

5

Area selection: New England Fold Belt, Queensland

5

  • Stream sediment coverage is very good for

most of the NEFB in Queensland

  • Au in streams (gridded image pictured)

shows a number of NE-SW oriented trends, interpreted to coincide with ‘belts’ of Permo- Carboniferous aged intrusions focused along deep-seated, arc-normal structures

200 km

slide-7
SLIDE 7

6

Area selection: New England Fold Belt, Queensland

6

  • Magnetic anomalies & mapped faults

(black) coincide with some of the Au geochemistry trends (blue lines)

  • The intersection of NW and NE trends (at

the regional scale) appears to exert a strong control over location of mineralisation

200 km

slide-8
SLIDE 8

7

Area selection: New England Fold Belt, Queensland

7

  • Gravity gradients coincide with a number of

the Au geochem trends

  • At the regional/state scale, mineralisation is

strongly related to the interplay between NE and NW trending structural elements

200 km

slide-9
SLIDE 9

8

Queensland – Major Au deposits in the NEFB

8

Charters Towers 16.6Moz

  • Mt. Carlton 1.35Moz Au,

+30Moz Ag, +60kt Cu

(Production commenced 2013) 1

  • Mt. Morgan 9.0Moz

Gympie 4.1Moz Ravenswood 4.1Moz Pajingo 3.8Moz (0.9Moz remaining resource) 1 Kidston 3.5Moz

  • Mt. Leyshon 3.1Moz
  • Mt. Rawdon

1.3Moz remaining resource 1 Cracow 2.0Moz + 0.77Moz remaining resource 1 Red Dome 1.5Moz

  • Mt. Wright 1.1Moz

Key to deposit age: Devonian – Carboniferous Permian – Carboniferous Permian - Triassic

Connors – Auburn magmatic arc Under-explored for epithermal/porphyry Au

1 = Evolution Mining Ltd website

200 km

slide-10
SLIDE 10

9

Connors Arc Epithermal Project

EPMA’s 19825, 25122, 25283 (new application)

100 km

  • Orion’s Connors Arc Project area now

comprises three exploration permit applications totaling 593km2

  • Immediately along strike from the Mt.

Mackenzie high sulphidation epithermal Au mineralisation - a very large, magmatic- hydrothermal system

  • Geological and structural setting of project

area in common with numerous epithermal and/or porphyry style systems (red)

  • Including active mines at +1Moz Au deposits:
  • Cracow (LS epithermal) –

4.29Mt @ 6.1g/t Au for 842koz Au 1 (remaining resource),

  • ca. 2Moz Au prior production
  • Mt. Carlton (HS epithermal) –

25Mt @ 1.7g/t Au for 1.35Moz Au 28.1Mt @ 35g/t Ag, 0.22% Cu for 31.2Moz Ag, 63.1kt Cu 1

1 = Evolution Mining Ltd website – December 2012 resources statement

slide-11
SLIDE 11

10

Understanding The Opportunity

  • Prior to major epithermal Au discoveries in the 1990’s (Pajingo, Cracow), the

established belief was that ‘fossil’ (pre-Cenozoic) epithermal systems had low prospectivity, due to poor preservation potential…

  • Occurrences were often interpreted as the remnant, low grade ‘roots’ of heavily eroded

systems

  • Target style was somewhat unpopular prior to the 1990’s success
  • Discoveries came about from a willingness to challenge this belief via deeper drill

testing of known systems, guided by geochemistry and geology (vein textures, alteration mineralogy)

  • Since the success of the 1990’s, greenfields exploration by larger companies for

deposits of this style gradually declined (in favour of more mature, near-term

  • pportunities offshore)
  • As a result, a number of prospective hydrothermal systems in settings such as the Connors-

Auburn arc remain under-explored

slide-12
SLIDE 12

11

Typical vertical metal zonation in low sulphidation epithermal gold systems

  • Anomalous Hg-Sb-As occur at high levels in system, above most prospective level for high

grade gold

  • Base metal (Cu-Pb-Zn) signature increases with depth and temperature
  • Key prospects within Orion’s project area display geochemistry and geology consistent with

a shallow level in system…

Epithermal systems – metal zonation

Interpreted erosional level for key prospects in ORN project areas

Metal Zonation

Modified after: Corbett & Leach, 1997 (Southwest Pacific rim gold copper systems: Structure, alteration and mineralisation)

slide-13
SLIDE 13

12

Aurora Flats Epithermal Au target

EPMA 19825 EPMA 25283 Powerline Prospect (possible extension of Aurora Flats vein system) Aurora Flats Prospect 1000m

  • Sparsely and shallowly drill-tested low

sulphidation epithermal quartz vein structure

  • The deepest intersections are ca. 80m below

surface, on two sections >800m apart!

  • Discontinuous outcrop/sub-crop of epithermal

vein material over approximately 1.5km of strike

  • Coincident anomalous Au in soils
  • Geochemistry and quartz vein textures from

historic shallow drilling are consistent with a shallow level in an epithermal system;

  • Strongly anomalous As, Hg
  • Ag-Te > Au signature
  • Logging of historic drill holes records presence
  • f chalcedony (low temperature cryptocrystalline

quartz)

  • Excellent potential for preservation of high

grade gold mineralisation below the present extent of drill testing and/or along strike

slide-14
SLIDE 14

13

Aurora Flats Epithermal Au target

  • Sparsely and shallowly drill-tested low

sulphidation epithermal quartz vein structure

  • The deepest intersections are ca. 80m below

surface, on two sections >800m apart!

  • Discontinuous outcrop/sub-crop of epithermal

vein material over approximately 1.5km of strike

  • Coincident anomalous Au in soils
  • Geochemistry and quartz vein textures from

historic shallow drilling are consistent with a shallow level in an epithermal system;

  • Strongly anomalous As, Hg
  • Ag-Te > Au signature
  • Logging of historic drill holes records presence
  • f chalcedony (low temperature cryptocrystalline

quartz)

  • Excellent potential for preservation of high

grade gold mineralisation below the present extent of drill testing and/or along strike

EPMA 19825 EPMA 25283

AFRC001

  • 2m @ 0.73g/t Au from 84m

Including:

  • 1m @ 1.14g/t Au, 77ppm Ag,

62ppm Te, 57.1ppm Hg from 84m

  • Anomalous As halo to

101ppm AFRC002

  • 4m @ 0.17g/t Au, 20ppm

Ag from 96m

  • Anomalous As halo to

155ppm

A B

PDH510

  • 2m @ 3.5g/t Au, 62g/t Ag

from 46m PDH512

  • 6m @ 0.3g/t Au, 1.0g/t Ag

from 12m Including

  • 2m @ 1.31g/t Au, 1.0g/t Ag

from 16m

  • Anomalous As halo to

82ppm

500m

slide-15
SLIDE 15

14

Aurora Flats Epithermal Au target

A

B Drillhole intersection 100m

Aurora Flats long section (A-B), looking north-west

  • Shallow, wide spaced drill intercepts (see Appendix 1 for drilling details)
  • As & Hg anomalism
  • Low grade Au plus Ag-Te signature
  • Typical shallow level expression of fertile epithermal structure

AFRC001

  • 2m @ 0.73g/t Au from 84m

Including:

  • 1m @ 1.14g/t Au, 77ppm

Ag, 62ppm Te, 57.1ppm Hg from 84m

  • Anomalous As halo to

101ppm AFRC002

  • 4m @ 0.17g/t Au, 20ppm Ag

from 96m

  • Anomalous As halo to 155ppm

PDH510

  • 2m @ 3.5g/t Au, 62g/t Ag

from 46m PDH512

  • 6m @ 0.3g/t Au, 1.0g/t Ag

from 12m Including:

  • 2m @ 1.31g/t Au, 1.0g/t Ag

from 16m

  • Anomalous As halo to 82ppm

Au in soils anomaly Au in soils anomaly Superficial cover – no surface expression of vein

1.5km of prospective strike (minimum)

slide-16
SLIDE 16

15

100m near- surface with characteristic geochem signature

Target Deposit Style Example

Schematic Long Section illustrating how early, shallow drilling intersected the vein structure and associated metals, but high grade gold shoots not detected until deeper follow-up drilling completed

Comparison with discoveries in the region - Cracow

Drillhole intersection

Modified after: Creenaune & Braund , 2001 (http:smedg.org.au/Sym01PC.htm )

slide-17
SLIDE 17

16

Forward Program

  • Progress tenement applications to grant
  • Anticipate grant of first tenement in Q2 FY13-14
  • Commence landholder liason/notice of entry

requirements upon grant of first tenement

  • Continue capture, compilation and assessment of
  • pen file geology, geophysics and geochemical

datasets

  • Capture and interpret ASTER spectral data to

assist in developing additional regional targets for follow-up

  • Scope out suitable geophysical methods for

regional and prospect scale target generation / assisting exploration for strike extensions to known targets (Aurora Flats)

  • Design first-pass reverse circulation drilling

program for Aurora Flats target

slide-18
SLIDE 18

17

APPENDIX 1

HISTORIC DRILL INTERCEPTS TABLES

slide-19
SLIDE 19

18

Historical Drill Intersections

Aurora Flats & Powerline historic drilling – calculated Au intercepts for drill holes displayed in presentation

Collar details Significant intersections

Hole ID Hole type Easting (MGA94_55) Northing (MGA94_55) RL (m) Dip (degrees) Magnetic Azimuth (degrees) Total depth (m) From (m) To (m) Interval (m) Au grade (g/t) Au Lower cut-off Ag grade (g/t) AFRC001 RC 743880.71 7481856.47 144.9

  • 60

106 120 84 86 2 0.73 0.3g/t 47 including 84 85 1 1.14 1.0g/t 77 AFRC002 RC 744139.68 7482680.37 145

  • 60

106 120 96 100 4 0.17 0.1g/t 20 PDH493 RAB 743930.55 7481787.13 144.33

  • 90

000 12 8 8 0.54 0.1g/t 2.5 PDH494 RAB 743921.56 7481792.13 144.36

  • 90

000 14 6 8 2 0.17 0.1g/t 6 PDH495 RAB 743966.56 7480151.14 140.94

  • 90

000 86 18 20 2 0.15 0.1g/t 20 26 28 2 0.14 0.1g/t 3 PDH496 RAB 743930.55 7480179.14 137.95

  • 90

000 82 No Significant Intersection PDH497 RAB 743939.56 7481782.13 144.30

  • 60

290 22 Assay Data Not Available PDH498 RAB 743909.56 7481799.13 144.40

  • 61.5

105 34 Assay Data Not Available PDH499 RAB 743928.56 7481806.13 144.69

  • 90

000 14 Assay Data Not Available PDH500 RAB 743932.56 7481805.13 144.70

  • 69

105 11.5 Assay Data Not Available PDH501 RAB 743924.56 7481790.13 144.34

  • 70

107 18 Assay Data Not Available PDH502 RAB 743923.56 7481791.13 144.35

  • 90

000 22 Assay Data Not Available PDH503 RAB 743969.56 7480152.14 141.10

  • 60

147 42 No Significant Intersection PDH508 RAB 743871.55 7481695.13 142.07

  • 62

98 12 Assay Data Not Available PDH509 RAB 743904.55 7481768.13 143.76

  • 62

110 26 4 6 2 0.11 0.1g/t 5 PDH510 RAB 743892.56 7481775.13 143.7

  • 62

108 56 46 48 2 3.5 1.0g/t 62 PDH511 RAB 743885.56 7481732.13 142.99

  • 62

113 26 No Significant Intersection

slide-20
SLIDE 20

19

Historical Drill Intersections

Notes:

  • Source of base data: Queensland Department of Natural Resources and Mines open file data (QDEX). Accessed June 2013
  • All holes shown were drilled in the period 1993 – 1998
  • Drilling samples comprised reverse circulation (RC) chips or rotary air blast (RAB) chips as indicated. Sampling methods employed are unknown
  • Intercept parameters: length-weighted average Au grades calculated above stated lower cut-off; nil internal dilution.
  • All samples other than for AFRC001 are two-metre composites (sampling method unspecified).
  • AFRC001 intercept comprises one-metre samples (sampling method unspecified)
  • Analytical methods and QA/QC measures unspecified

Aurora Flats & Powerline historic drilling – calculated Au intercepts for drillholes displayed in presentation (continued)

Collar details Significant intersections

Hole ID Hole type Easting (MGA94_55) Northing (MGA94_55) RL (m) Dip (degrees) Magnetic Azimuth (degrees) Total depth (m) From (m) To (m) Interval (m) Au grade (g/t) Au Lower cut-off Ag grade (g/t) PDH512 RAB 743957.56 7481881.13 147.2

  • 62

113 20 12 18 6 0.3 0.1g/t 1.0 including 16 18 2 1.31 1.0g/t 1.0 PDH513 RAB 743970.55 7480127.14 141.44

  • 62

115 40 No Significant Intersection PDH514 RAB 743940.56 7480156.14 139.22

  • 72

118 70 No Significant Intersection PDH520 RAB 743882.56 7481087.13 135.82

  • 71.5

108 36 No Significant Intersection PDH521 RAB 743885.56 7481086.13 135.81

  • 62

108 18 No Significant Intersection PDH522 RAB 743894.56 7481135.13 134.85

  • 81

109 16 10 12 2 0.1 0.1g/t 1.0 PDH523 RAB 743958.56 7480141.14 140.67

  • 90

000 36 No Significant Intersection PDH524 RAB 744089.56 7480374.14 139.04

  • 90

000 18 No Significant Intersection

slide-21
SLIDE 21

20

Competent Persons Statement

Information in this report which related to Exploration Results and other technical information is based on information compiled by Mr Ben Spence (B.AppSc), who is a Member of the Australian Institute of Geoscientists. Mr Spence is a full-time employee of Orion Gold

  • NL. He has sufficient experience that is relevant to the styles of mineralisation and types of deposits under consideration and to the

activity being undertaken to qualify as a Competent Person as defined in the 2004 Edition of the Australasian Code for Reporting of Exploration Results, Mineral Resources and Ore Reserves (“JORC Code”). Mr Spence consents to the inclusion in this announcement of the matters based on his information in the form and context in which it appears.