optiMize Plant Wide Automatic Process & Production Diagnostics - - PowerPoint PPT Presentation

optimize plant wide automatic process production
SMART_READER_LITE
LIVE PREVIEW

optiMize Plant Wide Automatic Process & Production Diagnostics - - PowerPoint PPT Presentation

optiMize Plant Wide Automatic Process & Production Diagnostics Hot Cold Foil Levelling Slitting Coating Casting Heating Testing Casting Automatic tracking of material and machine performance through the whole process Finishing


slide-1
SLIDE 1

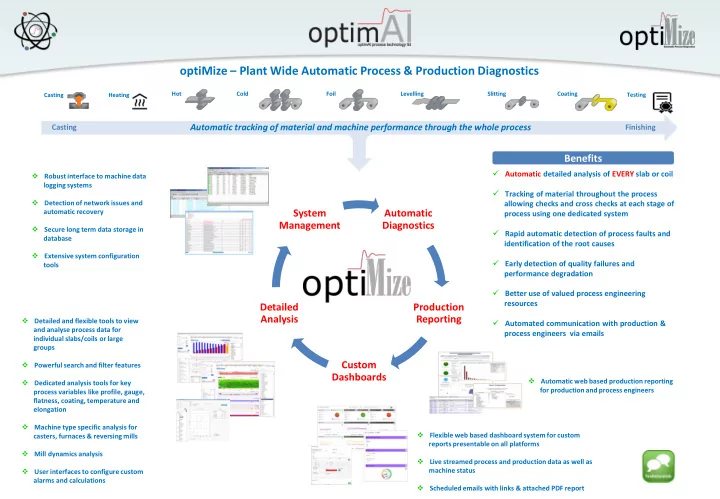
Automatic Diagnostics Production Reporting Custom Dashboards Detailed Analysis System Management

Hot Slitting Levelling Coating Cold Foil

Automatic tracking of material and machine performance through the whole process

Casting Finishing

Casting Heating Testing

  • ptiMize – Plant Wide Automatic Process & Production Diagnostics

 Automatic detailed analysis of EVERY slab or coil  Tracking of material throughout the process allowing checks and cross checks at each stage of process using one dedicated system  Rapid automatic detection of process faults and identification of the root causes  Early detection of quality failures and performance degradation  Better use of valued process engineering resources  Automated communication with production & process engineers via emails

 Automatic web based production reporting for production and process engineers  Flexible web based dashboard system for custom reports presentable on all platforms  Live streamed process and production data as well as machine status  Scheduled emails with links & attached PDF report  Detailed and flexible tools to view and analyse process data for individual slabs/coils or large groups  Powerful search and filter features  Dedicated analysis tools for key process variables like profile, gauge, flatness, coating, temperature and elongation  Machine type specific analysis for casters, furnaces & reversing mills  Mill dynamics analysis  User interfaces to configure custom alarms and calculations  Robust interface to machine data logging systems  Detection of network issues and automatic recovery  Secure long term data storage in database  Extensive system configuration tools

Benefits

slide-2
SLIDE 2
  • ptiMize
  • Plant Wide Automatic Diagnostic System
slide-3
SLIDE 3

 The optiMize system provides automated analysis and diagnostic facilities plant wide, from casting, pre-heating, hot rolling, cold rolling through to finishing processes like edge trimmers, slitters and coating lines, delivering clear feedback to machine operators & supervisors, production & process engineers  optiMize system provides:

 Automatic detailed analysis of EVERY slab or coil processed in the machines connected to the system  Tracking of material throughout the process allowing checks and cross checks at each stage of process using one dedicated system  Rapid automatic detection of process faults and identification of the root causes  Early detection of quality failures and performance degradation  Automated communication with process engineers and production management via email  Extensive graphical tools for process and production engineers and managers to assist in diagnosing the fault conditions quickly  Automatic reporting (shift, day, weekly) to production and process engineers via email containing links to web based reports  Automatic feedback to key performance indicators to L3 production systems (SAP etc.)  Better use of valued process engineering resources

  • ptiMize – Objective

The purpose is to generate valuable information out of data!

slide-4
SLIDE 4
  • ptiMize – System Overview

 ONE solid data tracking & automatic diagnostic system for ALL machines in the plant

Firewall

Data Logging PC: * optiMize Machine Manager * optiMize Live Server * optiMize Signal Configuration

Machine Network Plant Network

  • ptiMize System Manager
  • ptiMize Machine Manager

User: * optiMize Client * optiMize WebReports * optiMize Dashboards

  • ptiMize Server (IT Room):

* optiMize Database (MySQL) * optiMize System Manager * optiMize Diagnostics * optiMize Web Reports (Web server) * optiMize Dashboards (Web Server) * optiMize Signal Configuration * optiMize Client

  • ptiMize Server (IT Room)

Switch Casting Data Logging VLAN Plant Network Customer (IT Room) Switch Hot Mill Data Logging VLAN Switch Cold Mill Data Logging VLAN Switch Leveller Data Logging VLAN Switch Slitter Data Logging VLAN Switch HOM Furnace Data Logging VLAN Switch Pre-Heat Furnace Data Logging VLAN

  • ptiMizeClient & optiMize WebReport Users

Switch Annealing Furnaces Data Logging VLAN

Core System Configuration Multi Machine Configuration

slide-5
SLIDE 5
  • ptiMize – Core Applications
  • ptiMize Client

Data Visualisation

  • ptiMize Dashboards
  • ptiMize Production Reports

Data Storage

  • ptiMize Database

Automatic Process & Production Diagnostics

  • ptiMize Diagnostics

System Management

  • ptiMize System Manager
  • ptiMize Live Server
  • ptiMize Machine Manager
  • ptiMize Signal Configuration
slide-6
SLIDE 6

Production Planning (ERP) MES (L2)

Control System

Data Logging

  • ptiMize – Plant Integration

 The optiMize system can be integrated into a plants production planning system and provide key processes indicators used by the production planning system to validate pieces or coils for further processing.

slide-7
SLIDE 7

System Management

slide-8
SLIDE 8
  • ptiMize – System Management: Diagnostics Control

 optiMize System Manager application is controlling the automatic diagnostics for all connected machines  Robust communication between optiMize applications and machine data logging including automatic recovery from network failures

Firewall

Data Logging PC: * optiMize Machine Manager * optiMize Live Server * optiMize Signal Configuration

Machine Network Plant Network

  • ptiMize System Manager
  • ptiMize Machine Manager

Watch dog

User: * optiMize Client * optiMize WebReports * optiMize Dashboards

Hand shake

  • ptiMize Server (IT Room):

* optiMize Database (MySQL) * optiMize System Manager * optiMize Diagnostics * optiMize Web Reports (Web server) * optiMize Dashboards (Web Server) * optiMize Signal Configuration * optiMize Client

slide-9
SLIDE 9
  • ptiMize – System Management: Data Storage

 Centralised storage of automatic diagnostic configuration parameters , alarms limits as well as traces and calculated results for all connected machines  Secure long term data storage using relation database (MySQL)  High lossless data compression for high resolution traces  Database replication available as option  Built-in clean up and table optimisation Database Data Storage

slide-10
SLIDE 10

 Data logging traces as well product and process information (PDI) to be used by the optiMize system are configured using a configuration tool

  • ptiMize – System Management: System Configuration

 Parameters and limits controlling the automatic process and production diagnostics are configured using intuitive user interfaces

Signal Configuration Automatic Diagnostics Configuration

slide-11
SLIDE 11

Automatic Diagnostics

  • ptiMize Diagnostics
slide-12
SLIDE 12
  • ptiMize – Automatic Diagnostics

Hot Mills Slitting Lines Levelling Lines Coating Lines Cold Mills Foil Mills

Data Generation & Management

Casters Furnaces

Data File Interface PDI & Trace Validation Database Management Machine and Instrumentation Dependent Analysis Casting Furnace

  • Rev. Mill Stat.

Profile Temperature Flatness Gauge Elongation Coating Material Testing Roll Tracking HGC Analysis Auto Slow Down Production Tracking Alarm Generation & Custom Evaluation Database Interface (IN) DC EMC HOM Pre Heating Annealing Gauge Mill Dynamics Gauge Gauge Gauge Flatness Roll Tracking HGC Analysis Production T. Flatness External/Customer Interface Component ID Database Interface (OUT) Report Generation

Additional details as example of analysis

slide-13
SLIDE 13
  • ptiMize – Automatic Diagnostics: Gauge Analysis [Head Length]

Detailed Specification Specific Analysis

slide-14
SLIDE 14
  • ptiMize – Automatic Diagnostics: Production Tracking

Detailed Specification Specific Analysis

slide-15
SLIDE 15
  • ptiMize – Automatic Diagnostics: HGC Analysis

Detailed Specification Specific Analysis

slide-16
SLIDE 16
  • ptiMize – Alarm Generation & Custom Evaluation

 Built-in industry standard alarms for key parameters like gauge, speed, tension etc. are configured using intuitive user interfaces  Email sent to designated individuals  Alarm summary in email text for quick alarm review  Alarm report (pdf) sent with email for quick alarm review  Feature to create custom:  Alarms  Warnings  Calculations  Events  Basic or complex process and production parameter evaluations are created using an intuitive user interface  Emails can be sent to designated persons  Results can be viewed and analyse in the optiMize data visualisation tools

Alarm Generation Custom Evaluation

slide-17
SLIDE 17

Detailed Analysis

  • ptiMize Client
slide-18
SLIDE 18
  • ptiMize Client

 Detailed and flexible graphical tool used to view and analyse process data for individual slabs/coils or large groups  Powerful search and filter features using product or process information provided in the data logging as well as results calculated by the optiMize Diagnostics application  Dedicated tool to view and analyse multiple process parameters and calculated results for small or large groups (many thousands) of slabs/coils providing an unique way to find parameter relationships as well as long term follow up or catching slow drifts in process or productivity  Features to quickly find outliers in large groups and navigate to detailed analysis tools for further analysis  High resolution traces for visualisation of logged analog and digital traces as well as built-in detailed colour (heat) maps and FFT charts with built-in theoretical roll markers enables fast decision making.  Features to save groups of slabs/coils for later use or as references as well as creating personalised views of favourite traces and calculated results in dedicated analysis tools  Built-in dedicated analysis tools for display of key rolling mill and finishing line process traces and calculated results:  Profile  Temperature  Gauge  Flatness  Coating  Elongation  Machine type specific analysis:  Casters  Furnaces  Reversing mills  Mill dynamics analysis  Detailed analysis of a mills actuator performance (load cells, pressure transducers, position transducers )  User interfaces to configure custom alarms and calculations

slide-19
SLIDE 19

Data Search & Analysis Group Generation

  • ptiMize Client – Data Search & Group Display

 Powerful search and custom filter feature enables the user to find individual slabs/coils or groups using product information and calculated results

Analysis Group Display

 Group of slabs/coil can be ordered by Piece ID or process order  Grouping and ordering prior to making final analysis group

slide-20
SLIDE 20
  • ptiMize Client – Group Analysis

Large Groups

 The power of group analysis….find patterns and relationships that cannot be found by looking at individual slabs or coils

Display Options Multiple Parameters

 Time/Process Order  X/Y  Plot calculated results for thousands of slabs/coil

slide-21
SLIDE 21

Profile

  • ptiMize Client – Rolling Mill Key Parameter Analysis

 Detailed analysis tools for key rolling hot and cold mill parameters

Temperature Flatness Gauge

slide-22
SLIDE 22

Coating Leveller Elongation Reversing Hot Mills General Traces

  • ptiMize Client – Finishing Line Parameter & Machine Specific Analysis

 Detailed analysis tools for finishing line key parameters and specific machines  Caster and furnaces can be analysed in the Trace Display tool FFT

slide-23
SLIDE 23

Test Summary

 Evaluation of mill dynamics and actuator performance

Roll Eccentricity Servo Valve Drift

  • ptiMize Client – Mill Dynamics

Mill Stretch

slide-24
SLIDE 24

Gap Frequency Response

 Evaluation of mill dynamics and actuator performance

Gap Step Response

  • ptiMize Client – Mill Dynamics

Position Transducer Performance

slide-25
SLIDE 25

Gauge Assessment: Coil body of coil gauge performance against product tolerances

User Case

Mill Productivity: Production management unaware that operators were

  • perating the mill in two distinct speed bands

Flatness Issues : Coolant temperature variability increases significantly

  • ptiMize Client – User Cases

 The power of group analysis….find patterns and relationships that cannot be found by looking at individual slabs or coils

User Case User Case User Case

Mill Practises : Large roll stress variation within each gauge range

slide-26
SLIDE 26

User Case

  • ptiMize Client – User Cases

User Case User Case

Gauge performance follow up after backup roll change Gauge head length evaluation for two different coils Flatness performance evaluation related to bend control

slide-27
SLIDE 27

Custom Dashboards

  • ptiMize Dashboards
slide-28
SLIDE 28
  • ptiMize Dashboards

 The web based dashboard system enables registered users to create dashboards containing widgets displaying calculated production or process results  The dashboards can be viewed on all platforms  Dashboards can be private, shared with other specified users or made public for any registered user within the company  Available widgets range from standard charts like scatter, line, pie, bar and table to more production specific widgets like time lines displaying machine run times (up time) and operator reported delay times (down time)  Real time production and process data as well as machine status streamed directly from the machines data logging systems can be displayed in dedicated widget via built in real time web server  Dashboards can operate in history mode displaying data for the last day, week, month or any selected date range as well as in polling mode where the dashboard is automatically updated at regular intervals and the results are dynamically update in the widgets  Scheduled emails can sent be sent containing links to a dashboard as well as a PDF report where PDF layout is defined using a report generator feature

Dashboards

slide-29
SLIDE 29
  • ptiMize Dashboards

Dashboard Creation Widget Creation Sharing options Scheduled Emails

slide-30
SLIDE 30
  • ptiMize Dashboards

Report Duration Real Time/Live Widgets Historic Mode Polling Mode

 Widgets are automatically update at regular intervals  Real time product and process data as well as machine status streamed directly from the machines data logging system  Report duration for reports are easily configured using quick select options or manual entry

slide-31
SLIDE 31

Production Reporting

  • ptiMize Web Report
slide-32
SLIDE 32
  • ptiMize Web Report – Report Generation

 User friendly controls are used to generate the predefined standard production reports  Automatic emails with a link to a report can be configure to be sent on a shift/day/weekly basis

Report Generation

slide-33
SLIDE 33
  • ptiMize Web Report – Production Reporting

 Machine production summary available in one page accessible on any platform

Production Summary Language Support

slide-34
SLIDE 34
  • ptiMize Web Report – Production Summary

 Machine dependent configuration of key production result parameters

Tension Leveller/Edge Trimmer Rolling Mill Reversing Hot Mill

slide-35
SLIDE 35
  • ptiMize Web Report – Details

 Detailed production summary available in table format as well as search and data export features

Detail Production Summary

slide-36
SLIDE 36
  • ptiMize Web Report – Process Overview

 Configurable process parameters used to quickly get an overview of any process issue

Process Overview

slide-37
SLIDE 37
  • ptiMize Web Report – Delay Data

 Production delays and scrap reported by operators are summarised in bar charts and detailed in a table

Delays Scrap

slide-38
SLIDE 38
  • ptiMize Web Report – Data Export

 Data export (csv) of production and process feature enables data analysis in other software packages

Data Export

slide-39
SLIDE 39

Testimonials & References

slide-40
SLIDE 40
  • ptiMize generates production reports to assist with

tracking performance and identifying equipment

  • issues. We use optiMize daily to produce SPC

charts using the Group Analysis tool. Process and electrical engineers use it for in depth problem

  • analysis. The optiMize system has proven to be

invaluable for identifying and controlling key process variables at our five stand tandem mill. Joey Bain, Five Stand Mill Superintenden ent Constellium

1 x Reversing Breakdown 1 x Intermediate Breakdown 1 x 4 Stand Finishing

Hot Rolling Cold Rolling Slitting

3 x Edge Slitting & Oiling 1 x 5 Stand Tandem 2 x 3 Stand Tandem 1 x Single Stand

Coating

1 x Continuous Coating Line

KEEPING YOUR PROCESS AT THE CENTRE OF EVERYTHING WE DO

Production management use the optiMize tools on a daily basis. The detailed web based production reports are projected in the morning meeting to identify key production and quality issues and to direct any necessary corrective actions

What Our Customer’s Say – Production Management

Constellium optiMize System

slide-41
SLIDE 41
  • ptimAl process technology Ltd was originally

commissioned to replace an existing gauge monitoring tool with the optiMize system. The finished product far exceeded expectations when it was implemented back in 2007. Since then the system has been expanded to include key process variables, process evaluations, alarms/alerts and

  • trending. The system is dynamic – if a variable

(analog, digital or virtual signal) is captured it can be displayed and analyzed. Data storage and retrieval is fast and reliable. The real beauty of the optiMize system is with a ten minute demo anyone can begin to use the tool effectively to analyze data. Constellium has implemented optiMize throughout the plant and relies heavily on it to monitor and maintain product

  • quality. It is an integral part of our Electronic Lot

Ticket System and SAP Quality Module. Shelley Wolf, Senior Syste tems Engineer Constellium

  • ptiMize incorporates tools to analyze the performance of key

parameters from hot mill profile through cold mill gauge and flatness to coating line thickness and distribution

Thickness Profile Analysis Gauge Analysis

  • ptiMize is fully integrated to the plant

quality systems, providing key feedback to the SAP quality module

What Our Customer’s Say – Quality Control

Constellium Quality Analysis

slide-42
SLIDE 42

This is a powerful system which can provide us extensive tools for tracking the process, finding and solving process failures. This system improves my work efficiency and I use optiMize on a daily basis. It can search and track the coil through the whole process. By using different tools in the system, we can analyse gauge deviation issues and track the root cause. For process follow up, we can select some coils (filter by gauge/ alloy etc. wide range of criteria) produced in a certain period, then use the group statistics tool to monitor the trend and find if there are any problems, such as gauge performance, flatness performance, etc. We also use the alarm mail facility to create process/production alarms.

  • ptiMize will automatically send alarm emails to

the related person if any key process values are

  • ut of control set point.

Maria Dong, Process Department Gränges Shanghai

1 x Reversing Twin Coiler

Hot Rolling Cold Rolling Slitting

2 x Heavy Gauge 1 x Light Gauge (Loop) 4 x Light Gauge (Tight) 1 x 2 Stand Tandem 3 x Single Stand PLANT TO PLANT BENCHMARKING

With optiMize installed at their plants in Sweden and China, Gränges can use the system to benchmark performance across the whole group and develop best practice

In order to meet their customer’s ever higher demands for quality and tighter tolerances Gränges use the optiMize suite of applications to track their process and evaluate coil quality

What Our Customer’s Say – Process Engineering

Gränges Shanghai optiMize System

slide-43
SLIDE 43

 Gränges AB (Sweden):

 3 DC Casters  1 Slab Scalper (Sold – to be installed)  5 Homogenising furnaces  16 Pre-heating furnaces  1 Reversing hot mill  1 Two stand finish hot mill  1 Two stand cold mill  2 Single stand cold mills  6 Annealing furnaces  6 Slitters (Sold – to be installed)  1 Leveller (Sold – to be installed)  Material Testing (Sold – to installed)

 Novelis Rogerstone (UK):

 1 Three stand cold mill  1 Single stand cold mill

 Novelis Bridgnorth (UK):

 2 Single stand foil mills The Novelis plants are now closed

  • ptiMize – References

 Gränges Shanghai Ltd (China):

 1 Reversing/finishing hot mill  1 Two stand cold mill  3 Single stand cold mills  2 Tension levellers  2 Heavy gauge Slitters  5 Light gauge Slitters

 Qixing (China):

 1 Reversing hot mill  1 Reversing/finishing hot mill

 Huafeng (China)

 1 single stand cold mill  4 light gauge slitters

 System is currently installed and active on 60 machines  Installations on 7 new machines to start later this year and early next year (2017)  Constellium, AL:

 2 Reversing hot mills  1 Four stand finishing hot mill  1 Five stand cold mill  1 Three stand cold mill  1 Two stand cold mill  1 Single stand cold mill  2 Edge Slitters  1 Coating line

 SSAB, AL:

 1 Reversing Steckel mill

 SSAB, IO:

 1 Reversing Steckel mill

Europe Asia USA Summary