Optical Heat Flux and Temperature Measurements on a 100 kW, Oxy-fuel - - PDF document

optical heat flux and temperature measurements on a 100
SMART_READER_LITE
LIVE PREVIEW

Optical Heat Flux and Temperature Measurements on a 100 kW, Oxy-fuel - - PDF document

Optical Heat Flux and Temperature Measurements on a 100 kW, Oxy-fuel Combustor Teri Draper 1 , Pal Toth 2 , Terry Ring 1 , Eric Eddings , 1 1 Institute for Clean and Secure Energy and Department of Chemical Engineering, University of Utah 2


slide-1
SLIDE 1

Optical Heat Flux and Temperature Measurements on a 100 kW, Oxy-fuel Combustor

Teri Draper1, Pal Toth2, Terry Ring1, Eric Eddings, 1

1Institute for Clean and Secure Energy and Department of Chemical Engineering, University of Utah 2Department of Combustion and Thermal Energy, University of Miskolc

Abstract Optical heat flux and temperature measurements were taken on a 100 kW, oxy-fuel combustor. These measurements utilized an infrared camera, two-color pyrometry and narrow-angle radiometers. Data from these three techniques were taken simultaneously at a single operating condition in order to examine reproducibility and to compare between

  • techniques. Comparable measurements were fairly stable with standard deviations within 1% of their respective
  • means. The radiometer and infrared measurements were very similar (within 1%) after correcting the infrared data for

differences in background material. The two-color measurements yielded temperatures ~250 K above the other techniques; however, the two-color technique measured in the hottest part of the flame while the other techniques did

  • not. Thus, this type of discrepancy is expected.

Introduction Optical measurements were taken on a larger-scale, 100 kW, oxy-fuel combustor located at the University of

  • Utah. The details of the construction of the facility have

been previously described [1]. The furnace has since been modified for recycled flue gas oxy-combustion; however, for this test campaign, pure CO2 was used to dilute the

  • flame. The fuel used was a bituminous, pulverized, Utah

Sufco coal. The optical measurements consisted of: a mid-wave infrared (MWIR) camera to measure radiative heat flux and temperature; a synchronized high-speed, visible camera with an image splitter and narrow-band filters to facilitate two-color pyrometry to measure temperature and soot concentration, and narrow-angle radiometers to measure incident radiative heat flux. Data from these three techniques were taken simultaneously. The purpose of this campaign was to examine the reproducibility of the measurements over time and to provide a comparison between different methods of heat flux and temperature measurement. Thus, a single

  • perating condition was used and 15 separate

measurements were made over a period of three days. The primary purpose of this experimental campaign was to validate combustion models. Thus, a quantification of the variability in the measurements over time was of high interest. Approach A FLIR SC6703 Mid-wave Infrared (MWIR) camera was used to take infrared images through the quartz windows on the reactor as seen in Figure 1. The wavelength range of the filter used was 3825-3975 nm. The pixel intensity was calibrated with a blackbody radiation source to produce a function between the pixel intensity from the camera and the total emissive power,

  • r heat flux [2]. The data in each pixel for each set of

images were then fit with a lognormal distribution. The mean of each lognormal distribution at each pixel gave a two-dimensional map of the average pixel response for

 Corresponding author: c.author@myadress.com

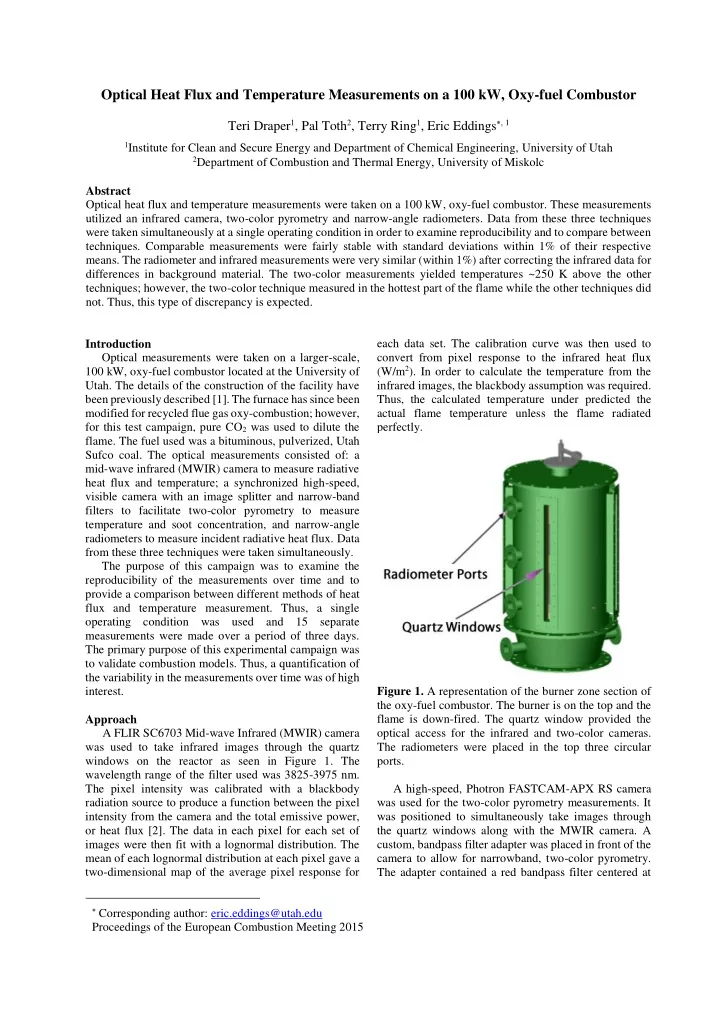
Proceedings of the European Combustion Meeting 2015 each data set. The calibration curve was then used to convert from pixel response to the infrared heat flux (W/m2). In order to calculate the temperature from the infrared images, the blackbody assumption was required. Thus, the calculated temperature under predicted the actual flame temperature unless the flame radiated perfectly. Figure 1. A representation of the burner zone section of the oxy-fuel combustor. The burner is on the top and the flame is down-fired. The quartz window provided the

  • ptical access for the infrared and two-color cameras.

The radiometers were placed in the top three circular ports. A high-speed, Photron FASTCAM-APX RS camera was used for the two-color pyrometry measurements. It was positioned to simultaneously take images through the quartz windows along with the MWIR camera. A custom, bandpass filter adapter was placed in front of the camera to allow for narrowband, two-color pyrometry. The adapter contained a red bandpass filter centered at

 Corresponding author: eric.eddings@utah.edu

Proceedings of the European Combustion Meeting 2015

slide-2
SLIDE 2

2 673 nm and a green bandpass filter centered at 550 nm. Both filters had narrow wavelength bands of 20 nm. The adapter also contained a beamsplitter and a mirror so that the red flame image and the green flame image were displayed on separate halves of the sensor (Figure 2). A calibrated tungsten filament lamp was used to calibrate both colors [2]. Similarly to the MWIR data, an average image was created for each of the 15 data sets. With the calibration for both colors relating emissive power to the pixel response and using the Hottel and Broughton soot emissivity model, Planck’s distribution was solved for temperature and soot concentration at each pixel. Figure 2. A schematic of the two-color adapter. Light from the flame enters the adapter and is divided by the

  • beamsplitter. Half the radiation passes through the

beamsplitter and through a red bandpass filter. The other half is reflected off the beamsplitter, onto a mirror and then passes through a green bandpass filter. The light from both filters then projects the same image at two different wavelength bands on separate halves of the camera sensor. Three narrow-angle radiometers were inserted into measurement ports along the side of the reactor (Figure 1). Each radiometer consisted of a sensor at the end of a long water-cooled jacket. This jacket created a narrow field of view (~2.7 degrees). The radiation entering through the probe was focused with a lens onto a

  • thermistor. The radiation changed the temperature of the

thermistor, which changed its resistance. This resistance change was also calibrated with a blackbody radiation source [3]. This technique measures radiation from the entire wavelength spectrum. The burner used was a simple, pipe-in-pipe burner without swirl (Figure 3). The electric wall heaters normally used to heat the walls within the reactor were

  • ut of order. They were removed and replaced with
  • refractory. Also, the three radiometers required a large

amount of CO2 flowing through them as a purge gas. This added an additional 6.8 lb/hr (50% of the CO2 flowing through the burner) into the reactor. The lack of wall heaters and the large amount of CO2 created an unattached, cooler, less-sooting flame. This in turn affected the fidelity of the two-color pyrometry results, since this measurement only works well at highly luminous, sooting areas in the flame. Figure 3. A representation of the coaxial, unswirled burner used during the experimental campaign. Primary

  • xygen, CO2, and pulverized coal enter through the inner
  • tube. The secondary oxygen and CO2 enter through the
  • uter annulus. Due to the lack of wall heaters in this

campaign, no secondary CO2 was used in an effort to keep the flame more stable. Results The average burner flow rates for the single condition examined are found in first section of Table 1. With standard deviations all within 1% of their means, the

  • perating conditions were found to be steady. A B-type

thermocouple encased in a ceramic sheath was inserted ~1 inch into the reactor to measure the gas temperature. As seen in Table 1, it also was very stable throughout the entire test campaign. This data leads to the conclusion that any unsteadiness seen in the data must be from the measurements themselves and not from changes in the flame itself. The MWIR camera yielded two-dimensional maps of heat flux, which are difficult to report in an aggregated

  • way. Thus, a centerline heat flux as a function of distance

from the burner averaged over all 15 repetitions is shown as the solid line in Figure 4. The dotted lines represent a single standard deviation of the data above and below the

  • mean. The gap in the data occurs because there is a small

3.2 cm long metal window frame that separates the top and bottom windows. This metal frame also the caused the second, smaller maxima, as it blocked a portion of the light immediately near it. Apart from that, the axial profile seen is to be expected. As the coal began to ignite and devolatilize, the heat flux increased. At the maximum, the heat gained from burning coal particles and the heat loss to the combustion environment were

  • balanced. Descending further down the flame, the

particles continued to lose heat to the reactor and the heat flux decreased. It should be noted that this camera has a wavelength band 150 nm in width and its heat flux is thus not directly comparable to that of the radiometers at this point. Two-color pyrometry also yielded two-dimensional maps of temperature, which are difficult to report. Thus, temperature as a function of distance from the burner averaged for all 15 repetitions is shown as the solid line in Figure 5. The dotted lines represent a single standard

slide-3
SLIDE 3

3 deviation of the data above and below the mean. The profile shape is similar to the MWIR data and is to be

  • expected. The flame length is much shorter than in the

axial profiles of the infrared data. This is because the flame radiated more in the infrared region and thus more flame was detected in those images. Soot dominates the radiation in the visible wavelength band, so this two- color setup (which measures in the visible range) only works well in regions of high soot. Due to the lack of wall heaters, this flame was relatively cold and less sooting, so the flame was typically only visible in these images at about 27-47 cm from the burner. Table 1. For ease of reference, all similar data is presented in this single table. Each parameter is presented with its average over the 15 data sets as well as its normalized standard deviation. The first section is composed of the reactor condition data: namely, the burner flow rates and the gas temperature. The second section presents the radiometer data. The last section presents the data from the three measurement techniques that were used to compare between them. The data sets most comparable between the three techniques are in bold. Mean

  • Std. Dev

/ Mean Coal Feed Rate, lb/hr 8.4 0.28% Primary O2 Rate, lb/hr 2.3 0.019% Secondary O2 Rate, lb/hr 16.5 0.084% Primary CO2 Rate, lb/hr 11.9 0.82% Secondary CO2 Rate, lb/hr

  • B-thermocouple, K

1242 0.31% Radiometer 1 Heat Flux, kW/m2 94.6 1.36% Radiometer 2 Heat Flux, kW/m2 129 0.58% Radiometer 3 Heat Flux, kW/m2 105 2.41% Full spectrum MWIR Blackbody Temperature, K 1095 0.47% Radiometer 2 Blackbody Temperature, K 1229 0.14% Full spectrum MWIR Blackbody Temperature w/ background correction, K 1214 0.36% Two-color Temperature, K 1474 0.86% Soot Concentration or KL 0.72 10.8% Visible Emissivity 0.81 3.73% Figure 6 shows the 15 heat flux measurements as a function of distance from the burner for the three

  • radiometers. Since the radiometer measurements were

point measurements, this shows a crude axial picture similar to those seen in the MWIR and two-color data. The ignition zone is again observed as the heat flux initially increased. The heat flux then decreased as heat loss became dominant. The averaged heat flux values for each radiometer are presented in the second section of Table 1 along with the corresponding normalized standard deviations. The bottom radiometer (Radiometer 3) had the highest standard deviation, which is to be expected as the unattached flame was very unstable in the area measured by that radiometer. Figure 4. The axial MWIR heat flux profile as a function

  • f distance from the burner averaged over the 15 data sets

(solid). The dotted lines represent one standard deviation above and below the mean. Figure 5. The axial two-color temperature profile as a function of distance from the burner averaged over the 15 data sets (solid). The dotted lines represent one standard deviation above and below the mean. Figure 6. The 15 heat flux measurements from each of the three, fixed radiometers.

slide-4
SLIDE 4

4 For ease of comparison between the three measurements, the temperature results rather than the heat flux results from the three methods were used. It must be noted that the radiometer and MWIR temperature measurements assume blackbody radiation, while the two-color data do not. These results are presented in the last section of Table 1. In order to clarify the area over which each technique measured to provide the information in Table 1, Figure 7 shows a diagram of the windows on the reactor, which are in blue. Only one

  • f the radiometers measured in an area where the MWIR

camera also detected a flame signal, which was the center, or second, radiometer. The green band represents the area of the flame that was averaged in the infrared images to compare with the radiometer measurements. The sooting area of the flame, or area of the flame detectable with the two-color method, did not overlap with any of the radiometer measurement areas, so a direct comparison with the two-color data and the two other methods was not possible. The yellow band represents the area where the flame was detectable in the visible two-color method. The temperature and soot concentration values were averaged over this area to give the two-color data in the last section of Table 1. In order to compare the radiometer and MWIR data, the MWIR heat flux data was adjusted from its narrowband spectrum to the full wavelength spectrum using Planck’s Distribution. Then, the blackbody temperature was calculated from both heat fluxes. A discrepancy of ~120 K was seen between the full spectrum, MWIR, blackbody temperature and the second radiometer blackbody temperature (Table 1). On further inspection, it was noted that due to their differing circumferential position in the reactor, the two techniques had different materials radiating in the background of their respective measurements. The MWIR camera “saw” through a window into the reactor and through a window of the same size on the opposite side of the

  • reactor. The radiometer faced the interior reactor wall,

which was made of refractory and was much hotter than the window. When the infrared images were analyzed at the interior wall and at the window at points without flame, a substantial difference in the pixel response was

  • found. This difference was added to every MWIR image

in order to imitate a background of refractory in an attempt to enable the MWIR measurements to be more comparable to those of the radiometer. Then, the MWIR blackbody temperature was again calculated and this result is also in Table 1 as the full spectrum, MWIR, blackbody temperature with background correction. As a result of this correction, the two blackbody temperatures are within ~1% of each other. As mentioned previously, the two-color temperature results cannot be directly compared to the other two techniques, because, e.g., the portion of flame that yielded two-color results did not have an overlapping radiometer area (Figure 7). They also cannot be directly compared because the other two measurements assume blackbody radiation, which will underpredict the actual flame temperature. As can be seen in Table 1, there is a difference of ~250 K between the two-color temperature and the corrected MWIR and radiometer blackbody

  • temperatures. The two-color soot concentration which

was solved for simultaneously with temperature is also

  • presented. A visible emissivity calculated from the soot

Figure 7. A representation of the quartz windows on the

  • xy-fuel reactor. The two windows are separated by a

small 3.2 cm gap (white) and are both 47 cm long. The

  • range sections represent the area over which the top and

bottom radiometers measured. The green section shows where the data from the second radiometer and the MWIR camera was analyzed in order to compare the two

  • methods. The B-type thermocouple also took gas

temperature data in this area. The yellow section shows the only area where the flame was visible and thus detectable with the two-color method.

slide-5
SLIDE 5

5 concentration is also presented, due to its familiarity. The emissivity measured by the two-color method was used to convert the second radiometer measurement to a temperature without the blackbody assumption. When this was done, the radiometer measurement was still about 175 K under the two-color results. This would imply that the temperature difference cannot be accounted for solely by the blackbody assumption despite the fact that the emissivity could be very different in wavelength bands other than the visible spectrum. Thus, the remainder of the discrepancy is attributed to the differing measurement areas of the three techniques, since the two-color data came from the hottest, most sooting portion of the flame and the radiometer and MWIR data came from a lower, cooler part of the flame. It has been established that the reactor conditions were quite stable. It is also seen in the last section of Table 1 that the comparable MWIR, radiometer and two- color data were quite stable as well, with standard deviations from the 15 repetitions over 3 days of less than 1% of their respective means. The two-color technique had the highest standard deviation, which was unsurprising given the highly turbulent nature of the

  • flame. This caused decidedly varying amounts of soot

from one image to the next. Because of this, the high standard deviation

  • f

the soot concentration measurements was also expected. Conclusions Optical heat flux and temperature measurements were taken on a 100 kW, oxy-fuel combustor. The measurements consisted of infrared imaging, two-color pyrometry and narrow-angle radiometers. The purpose of this campaign was to 1) examine the reproducibility of the measurement techniques in order to quantify uncertainty for combustion models; and 2) compare the results between the three different techniques. It was seen that the reactor flow rates and internal gas temperature were very steady over the three day campaign, as they remained within 1% of their respective

  • means. The data collected from each of the three

techniques were steady as well, with the three most comparable measurements (radiometer 2 blackbody temperature, the full spectrum MWIR blackbody temperature with background correction and the two- color temperature) also within 1% of their respective

  • means. Thus, both the reactor and measurement

techniques proved to be highly reproducible, which will provide confidence in future campaigns. The axial profiles of heat flux or temperature as a function of distance from the burner were all in rough agreement, as each had a similar shape. Heat flux or temperature went up as coal ignited and then down as the flame cooled. The average radiometer and MWIR data were very similar (within 1%) after correcting for the difference in radiating background material. The two- color data was significantly higher, even after accounting for the blackbody assumption that the other two techniques required. It was hypothesized that this discrepancy was due to the difference in measurement

  • location. The two-color technique measured at the most

luminous – and presumably the hottest – part of the flame, while the radiometer was fixed at a cooler point lower in the flame. Thus, this disparity is not unexpected. References [1] J. Zhang, K.E. Kelly, E.G. Eddings, J.O.L. Wendt, Ignition in 40kW co-axial turbulent diffusion oxy- coal jet flames, Proceedings of the Combustion Institute (2011) 3375-3382. [2] K.I. Svensson, A.J. Mackrory, M.J. Richards, D.R. Tree, SAE SP 1971 (2005) 69-86. [3] D. Rezaei, Co-axial Turbulent Diffusion Flames with Directed Oxygen Injection, Ph.D. Dissertation,

  • Dept. of Chemical Engineering, University of Utah,

2013. Acknowledgements This material is based upon work supported by the U.S. Department of Energy under Award Number DE- NT0005015, and by the Department of Energy, National Nuclear Security Administration, under Award Number DE-NA0002375.