
SLIDE 1
Rachel A.Smith, SIT Conference 2010 1
“Only Connect”:
A Mixed Methods Study of How First-Year Students Create Residential Academic and Social Networks
Rachel A. Smith Baruch College, CUNY rachel.smith@baruch.cuny.edu Conference on Students in Transition November 14, 2010
Acknowledgements
Funded through the 2009-2010 Paul P. Fidler
Grant from the National Resource Center for The First-Year Experience and Students in Transition
Thank you to my participants and staff in
residence life and the learning communities
- ffice
Introduction
First-year college students: new environment,
need to create academic/social relationships
College administrators structure environments
where students are more likely to create certain relationships (e.g. learning communities) Littl i k b t h th ifi “ t k ”
Little is known about how these specific “networks”
- f relationships facilitate educational outcomes
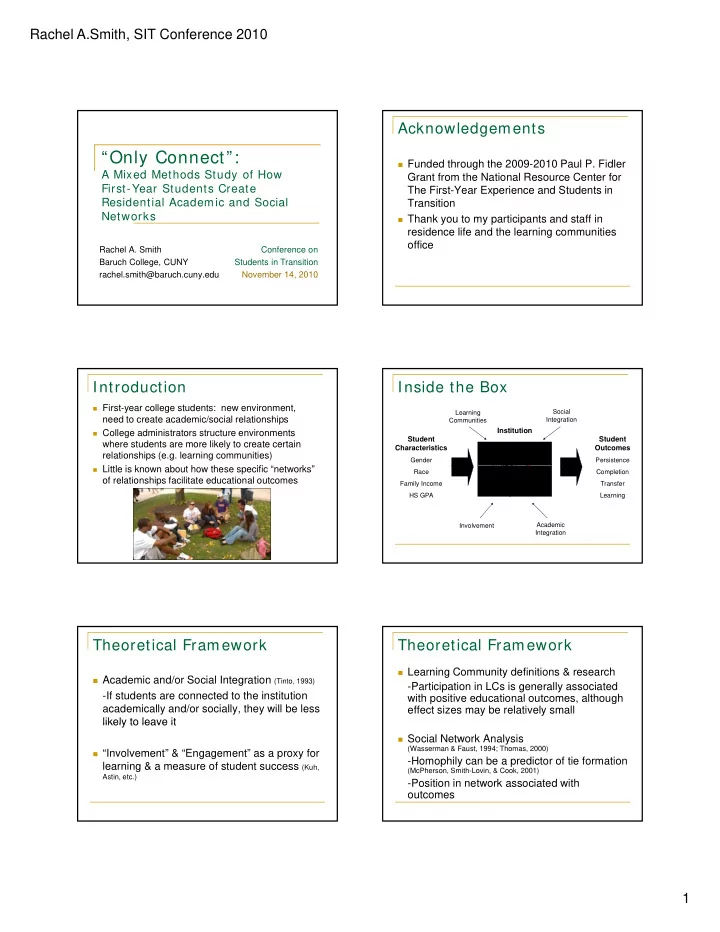
Inside the Box
Student Characteristics
Gender
Student Outcomes
Persistence Social Integration Learning Communities
Institution
Race Family Income HS GPA Completion Transfer Learning Involvement Academic Integration
Theoretical Framework
Academic and/or Social Integration (Tinto, 1993)
- If students are connected to the institution
academically and/or socially, they will be less likely to leave it likely to leave it
“Involvement” & “Engagement” as a proxy for
learning & a measure of student success (Kuh,
Astin, etc.)
Theoretical Framework
Learning Community definitions & research
- Participation in LCs is generally associated
with positive educational outcomes, although effect sizes may be relatively small
Social Network Analysis (Wasserman & Faust, 1994; Thomas, 2000)
- Homophily can be a predictor of tie formation
(McPherson, Smith-Lovin, & Cook, 2001)
- Position in network associated with
- utcomes