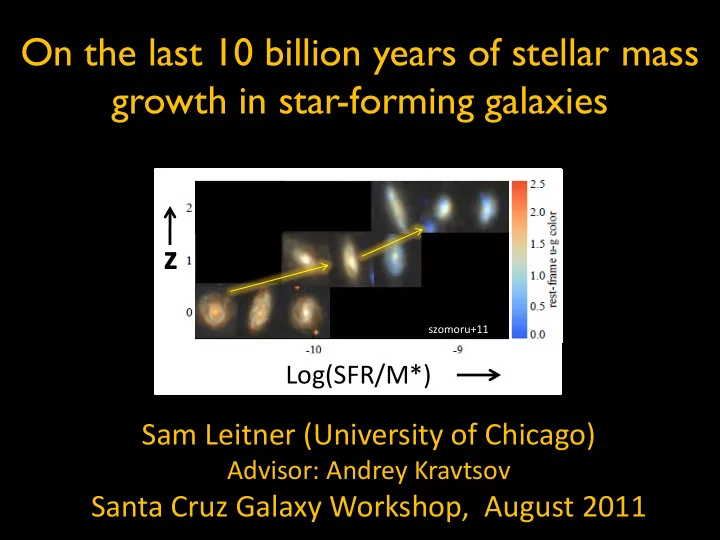
SLIDE 1 On the last 10 billion years of stellar mass growth in star-forming galaxies
Sam Leitner (University of Chicago)
Advisor: Andrey Kravtsov
Santa Cruz Galaxy Workshop, August 2011
szomoru+11
Log(SFR/M*)
z
SLIDE 2 Small scatter in SFR at M*:
- z≈0 in SDSS (e.g. Brinchmann+04)
- z≈0 in local dwarfs (Lee+11)
- z≈2 in M* >1010 (e.g. Rhodighiero+11)
A persistent SFR main sequence
SFR-M* SFR-M*
Dwarfs
SDSS
Salim+07 Lee+11 Rhodighiero+11
z≈0 z≈2 σ=0.24dex z≈0
log (SFR) log (SFR/M*)
log (M*) log (M*)
log (SFR/M*)
SLIDE 3
Main Sequence Integration
stellar mass fraction formed
SLIDE 4
Main Sequence Integration
stellar mass fraction formed
SLIDE 5
Main Sequence Integration
stellar mass fraction formed
SLIDE 6
Main Sequence Integration
stellar mass fraction formed
SLIDE 7 Small scatter in SFR at M*:
- z≈0 in SDSS (e.g. Brinchmann+04)
- z≈0 in local dwarfs (Lee+11)
- z≈2 in M* >1010 (e.g. Rhodighiero+11)
A persistent SFR main sequence
SFR-M* SFR-M*
Dwarfs
SDSS
Salim+07 Lee+11 Rhodighiero+11
σ=0.24dex
z≈0 z≈2 z≈0
log (SFR) log (SFR/M*)
log (M*) log (M*)
log (SFR/M*)
SLIDE 8 Small scatter in SFR at M*:
- z≈0 in SDSS (e.g. Brinchmann+04)
- z≈0 in local dwarfs (Lee+11)
- z≈2 in M* >1010 (e.g. Rhodighiero+11)
A persistent SFR main sequence
SFR-M* SFR-M*
Dwarfs
SDSS
Salim+07 Lee+11 Rhodighiero+11
σ=0.24dex
z≈0 z≈2 z≈0
log (SFR) log (SFR/M*)
log (M*) log (M*)
log (SFR/M*)
z≈0
SFR
z≈2
Wuyts+11
SLIDE 9
SLIDE 10 SFR(1011Mʘ,z)/M*[1/Gyr]
10 1 0.1 0.01
Observations: normalization of SFR-M*
Salim et al. 2007; Noeske et al. 2007b; Elbaz et al. 2007; Pannella et al. 2009; Daddi et al. 2007; Dunne et al. 2009; Oliver et al. 2010; Rodighiero et al. 2010a Karim et al. 2011;
SLIDE 11 SFR(1011Mʘ,z)/M*[1/Gyr]
10 1 0.1 0.01
Observations: normalization of SFR-M*
Salim et al. 2007; Noeske et al. 2007b; Elbaz et al. 2007; Pannella et al. 2009; Daddi et al. 2007; Dunne et al. 2009; Oliver et al. 2010; Rodighiero et al. 2010a Karim et al. 2011;
SLIDE 12 Observations: slope SFR/M*~M*
β
β 0.0
0.4 0.2 smaller galaxies grow faster (implies downsizing)
SLIDE 13 Observations: slope SFR/M*~M*
β
β 0.0
0.4 0.2 smaller galaxies grow faster (implies downsizing)
SLIDE 14
108 109 1010 1011
Typical stellar mass growth from main sequence integration
Extrapolated data Unreliable(ρSFR≠∆ρ*) Robust early growth
star formation histories stellar mass growth
SLIDE 15
Quantifying the late formation of star forming galaxies
z15%: M(z)=0.15M*(z=0)
SLIDE 16
Quantifying the late formation of star forming galaxies
z15%: M(z)=0.15M*(z=0)
SLIDE 17
Quantifying the late formation of star forming galaxies
z15%: M(z)=0.15M*(z=0) stellar mass at z=1
SLIDE 18
Stellar mass growth from spectra
star formation histories stellar mass growth
Averaged SED-based SFHs of ~50,000 SDSS star-forming galaxies of 1010.5-1011Mʘ from the VESPA Database
<M*>=6x10¹⁰Mʘ
SLIDE 19 Mimicking age uncertainty
SSPs with typical SDSS signal-to noise are not distinguished over <0.5dex:
Tests show little bias, but resolution~1dex for non-SSPs with unknown metallicity
- >Smooth by σ=0.5dex in log-age
Main Sequence Integration MSI+age uncertainty
Ocvirk+06
SLIDE 20 Main sequence integration and SEDs
<M*>=6x10¹⁰Mʘ
Main Sequence Integration MSI+age uncertainty
SLIDE 21
Main sequence integration and SEDs
<M*>=2x10¹⁰Mʘ
SLIDE 22
Main sequence integration and SEDs
<M*>=5x10⁹Mʘ
SLIDE 23
Main sequence integration and SEDs
<M*>=2x10⁸Mʘ
SLIDE 24 Consistency between SEDs and the main sequence
<M*>=5x10⁹Mʘ <M*>=6x10¹⁰Mʘ <M*>=2x10¹⁰Mʘ <M*>=2x10⁸Mʘ
SLIDE 25
A transition at low masses?
SLIDE 26
A transition at low masses? An SED/CMD discrepancy?
SLIDE 27 Summary and Conclusions
- The main sequence of star formation can be integrated to calculate
stellar mass growth in star forming galaxies back to 10-20% of current stellar masses.
- Less than 15% of stellar mass (median bulge mass) is in place in star
forming galaxies of about M*=1-5x10¹⁰ SFGs at z>2.
- SED-based star formation histories are consistent with SFR-M* and
its evolution after accounting for age uncertainties.
- Local CMD-analyzed dwarfs formed early(?) compared to SED and
main sequence extrapolations.
- Details: merging, ρSFR≠∆ρ* , effect of scatter in SFR-M*, other high
S/N SED- and CMD-based disk observations. arXiv:1108.0938
SLIDE 28
SLIDE 29
SLIDE 30
Merging and Scatter
SLIDE 31
The effect of age resolution on mass growth in SED-based SFHs