
SLIDE 1
7/26/2018 North Basin 1
OCWD Groundwater Basin Storage Evaluation
Joint Planning Committee July 25, 2018
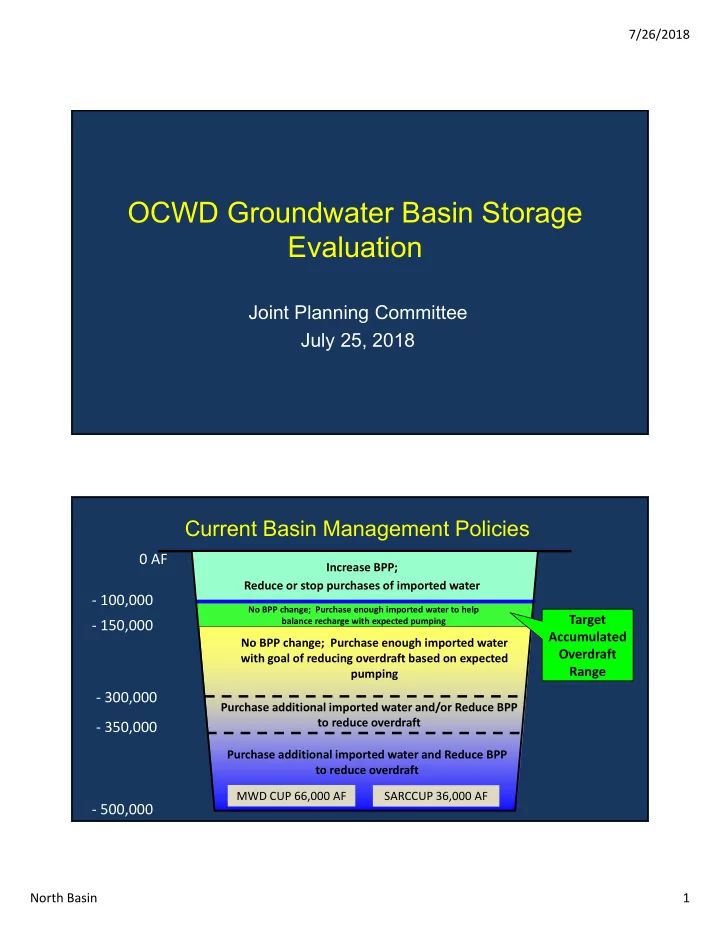
Current Basin Management Policies
‐ 500,000 0 AF ‐ 100,000
No BPP change; Purchase enough imported water to help balance recharge with expected pumping
Increase BPP; Reduce or stop purchases of imported water No BPP change; Purchase enough imported water with goal of reducing overdraft based on expected pumping
‐ 150,000
Purchase additional imported water and/or Reduce BPP to reduce overdraft Purchase additional imported water and Reduce BPP to reduce overdraft
‐ 350,000 ‐ 300,000
MWD CUP 66,000 AF SARCCUP 36,000 AF
Target Accumulated Overdraft Range