
SLIDE 1
Numerical Modelling of the cloud–aerosol interactions for VOCALS
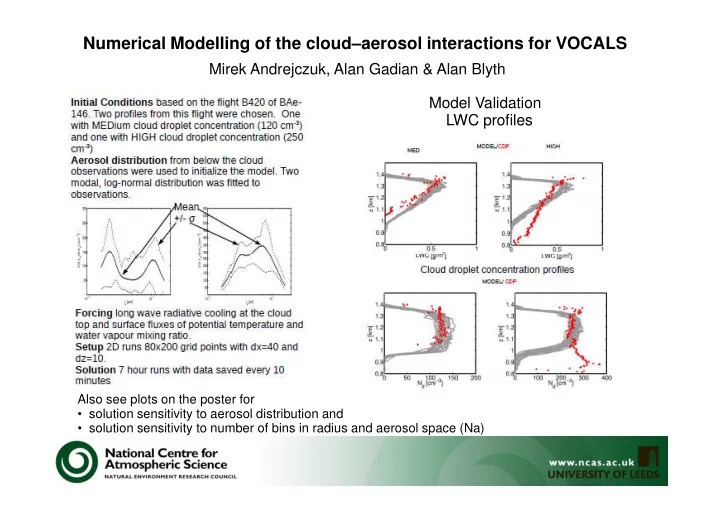
Mirek Andrejczuk, Alan Gadian & Alan Blyth Model Validation LWC profiles
Also see plots on the poster for
- solution sensitivity to aerosol distribution and
- solution sensitivity to number of bins in radius and aerosol space (Na)