
SLIDE 1
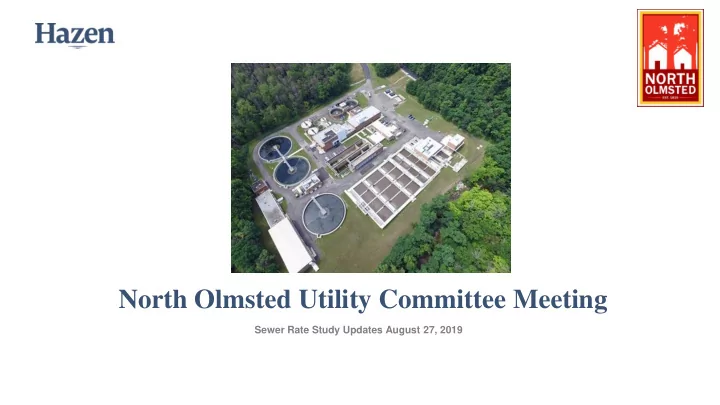
North Olmsted Utility Committee Meeting
Sewer Rate Study Updates August 27, 2019
North Olmsted Utility Committee Meeting Sewer Rate Study Updates - - PowerPoint PPT Presentation
North Olmsted Utility Committee Meeting Sewer Rate Study Updates August 27, 2019 Agenda Introductions Model Structure Proposed Rate Structure Changes Comparisons to Nearby Communities Financial and Affordability Projections
Sewer Rate Study Updates August 27, 2019
2
ability to generate necessary revenue to:
‒ Maintain operation of sewer treatment system(s) and current debt retirement ‒ Fund any necessary future improvements and CIP
rate structure to support goals in a fair and equitable manor among all rate payers
affordability and any future regulatory schedules
3
4
Examples:
Operating Income
= Net Operating Income
Examples:
Considering Current Loans and CIP, Develop:
5
6
Quarterly Proposed Monthly < 1 MCF = $30.38 + $55.68/ MCF Minimum = $10.51 1 MCF or more = $30.38/MCF + $55.68/MCF Usage = $86.06/MCF
7
8
*this does not consider affordability or homestead discount rates.
9
6.06% 0.05% 1.0% 1.4% 24.91% 7.3% 8.3% 7.5% 25.76% 13.8% 13.7% 13.6% 35.48% 31.8% 31.1% 31.2% 5.85% 10.0% 9.8% 9.8% 3 - 5, 0.58% 2.8% 2.8% 2.8% > 5, 1.36% 34.3% 33.4% 33.6% 0% 10% 20% 30% 40% 50% 60% 70% 80% 90% 100%
% of Accounts % of Usage % of 2019 Revenue % of 2020 Revenue 0 - 0.1 0.1 - 0.33 0.33 - 0.5 0.5 - 1 1 - 3 3 - 5 > 5 Account Usage per Bill Period (MCF)
10
Current/2020 Rate Homestead or Affordability Rate North Olmsted $86.06/MCF $5.25 + $43.03/MCF NEORSD (Suburbs)* $100.75/MCF $60.50/MCF Lakewood $75/MCF $56.30/MCF CWD (First High Service; 5/8-inch) $9.20 + $48.28/MCF (>0.2) $5.80 + $18.46/MCF Westlake (Single Family) $40 per quarter (~$13.33/mo) n/a Lorain $15 + $63.80/MCF n/a Summit County (Residential) $56.03+ $66.70/MCF n/a
11
12
Revenue and Expense Inputs and Assumptions
13
FY FY FY FY FY FY FY FY FY FY FY 2017 2018 2019 2020 2021 2022 2023 2024 2025 2026 2027 Residential Rate Increase n/a 3.0% 3.0% 0.0% 0.0% 2.0% 2.0% 2.0% 2.0% 2.5% 2.5% Commercial Rate Increase (NOT USED) n/a Total Number of Customers 11921 11921 11921 11921 11921 11921 11921 11921 11921 11921 11921 Operating Incomes User Charges (Actual or Projected) $9,082,700 $8,801,313 $9,065,352 $9,372,331 $9,372,331 $9,559,777 $9,750,973 $9,945,992 $10,144,912 $10,398,535 $10,658,499 User Charges (Actual or Projected) with Collection Shortfall $9,082,700 $8,554,121 $9,065,352 $9,109,102 $9,109,102 $9,291,284 $9,477,109 $9,666,651 $9,859,984 $10,106,484 $10,359,147 Non-Metered Revenue $0 $0 $0 $0 $0 $0 $0 $0 $0 $0 $0 Residential Metered Revenue $9,055,650 $8,801,313 $9,065,352 $9,465,923 $9,465,923 $9,655,241 $9,848,346 $10,045,313 $10,246,219 $10,502,375 $10,764,934 Less Homestead Accounts n/a n/a n/a
Homestead Program Revenue n/a n/a n/a $80,830 $80,830 $82,446 $84,095 $85,777 $87,493 $89,680 $91,922 Less Affordability Accounts n/a n/a n/a
Affordability Program Revenue n/a n/a n/a $12,756 $12,756 $13,011 $13,271 $13,536 $13,807 $14,152 $14,506 Anticipated Decrease in Revenue from Decreased Usage n/a $0 $0 $0 $0 $0 $0 $0 $0 $0 $0 Anticipated Revenue from New Connections n/a $0 $0 $0 $0 $0 $0 $0 $0 $0 $1 Other Revenue (including Fairview Park and Olmsted Township Revenue) $1,684,889 $1,608,038 $1,608,038 $1,608,038 $1,608,038 $1,608,038 $1,608,038 $1,608,038 $1,608,038 $1,608,038 $1,608,038 Revenue Adjustments (+ or -) $0 $0 $0 $0 $0 $0 $0 $0 $0 $0 $1 TOTAL $10,767,588 $10,162,159 $10,673,390 $10,717,140 $10,717,140 $10,899,322 $11,085,147 $11,274,689 $11,468,023 $11,714,522 $11,967,186 Operating Costs Inflation Factor % Salaries & Benefits for Administration Staff 2.0% $423,950 $432,429 $441,078 $449,899 $458,897 $468,075 $477,437 $486,985 $496,725 $506,660 $516,793 Billing, Office Operation & Utilities, Rent & Other Overhead 2.0% $568,036 $579,396 $590,984 $602,804 $614,860 $627,157 $639,700 $652,494 $665,544 $678,855 $692,432 Insurance & Bonding 2.0% $88,426 $90,195 $91,999 $93,839 $95,715 $97,630 $99,582 $101,574 $103,605 $105,677 $107,791 Accounting, Legal, Engineering & Other Professional Services 2.0% $279,483 $285,073 $290,774 $296,590 $302,521 $308,572 $314,743 $321,038 $327,459 $334,008 $340,688 R&R Reserve Payments 0.0% $500,000 $50,000 $1,240,000 $1,007,000 $802,000 $997,000 $792,000 $722,000 $880,280 $854,429 $865,125 Capital Reserve Payments 2.0% $0 $0 $0 $0 $0 $0 $0 $0 $0 $0 $0 Salaries & Benefits for Operations Staff 2.0% $2,096,292 $2,138,218 $2,180,982 $2,224,602 $2,269,094 $2,314,476 $2,360,765 $2,407,981 $2,456,140 $2,505,263 $2,555,368 Utilities for Operations 2.0% $126,605 $129,137 $131,720 $134,354 $137,041 $139,782 $142,578 $145,429 $148,338 $151,304 $154,331 Operating Supplies & Equipment 2.0% $450,380 $459,388 $468,576 $477,947 $487,506 $497,256 $507,201 $517,345 $527,692 $538,246 $549,011 Chemicals 2.0% $91,631 $93,464 $95,333 $97,240 $99,184 $101,168 $103,192 $105,255 $107,360 $109,508 $111,698 Equipment Leases 2.0% $0 $0 $0 $0 $0 $0 $0 $0 $0 $0 $0 Regular Maintenance & Repairs 2.0% $163,386 $166,654 $169,987 $173,386 $176,854 $180,391 $183,999 $187,679 $191,433 $195,261 $199,167 Auto & Other Rolling Stock 2.0% $0 $0 $0 $0 $0 $0 $0 $0 $0 $0 $0 Permits, Training 2.0% $16,759 $17,095 $17,436 $17,785 $18,141 $18,504 $18,874 $19,251 $19,636 $20,029 $20,430 Taxes and Franchise Fees 0.0% $0 $0 $0 $0 $0 $0 $0 $0 $0 $0 $0 Electricity for Operations 2.0% $453,885 $462,962 $472,221 $481,666 $491,299 $501,125 $511,148 $521,371 $531,798 $542,434 $553,283 Sludge Disposal 2.0% $160,384 $163,591 $166,863 $170,200 $173,604 $177,076 $180,618 $184,230 $187,915 $191,673 $195,507 Separation Accrual/27th Pay 2.0% $51,000 $52,020 $53,060 $54,122 $55,204 $56,308 $57,434 $58,583 $59,755 $60,950 $62,169 Cost Adjustments (+ or -) $0 $0 $0 $0 $0 $0 $0 $0 $0 $0 $1 TOTAL $5,470,216 $5,119,621 $6,411,013 $6,281,433 $6,181,922 $6,484,520 $6,389,271 $6,431,216 $6,703,681 $6,794,298 $6,923,792 Net Operating Income $5,297,372 $5,042,538 $4,262,377 $4,435,706 $4,535,218 $4,414,801 $4,695,876 $4,843,473 $4,764,342 $4,920,224 $5,043,395 Capital Reserve Costs Inflation Factor % Debt Service - Current Loans n/a $3,788,385 $3,766,676 $3,831,872 $3,811,967 $3,787,958 $3,787,958 $3,787,958 $3,787,958 $3,787,958 $3,787,958 $3,787,958 Capital Replacement & Improvement 2.0% $69,235 $70,620 $72,032 $73,473 $74,942 $76,441 $77,970 $79,529 $81,120 $82,742 $84,397 Debt Service - Future Loans n/a $20,842 $84,600 $87,200 $89,600 $336,932 $335,532 $582,164 $585,064 $582,064 $584,064 $585,864 TOTAL $3,878,462 $3,921,896 $3,991,104 $3,975,040 $4,199,832 $4,199,931 $4,448,092 $4,452,551 $4,451,142 $4,454,764 $4,458,219 R&R Reserve Costs Inflation Factor % Asset Renewal Costs - Cash $0 $0 $1,190,000 $957,000 $752,000 $947,000 $742,000 $672,000 $830,280 $804,429 $815,125 Emergency Dig Jobs 0.0% $50,000 $50,000 $50,000 $50,000 $50,000 $50,000 $50,000 $50,000 $50,000 $50,000 $50,000 TOTAL $50,000 $50,000 $1,240,000 $1,007,000 $802,000 $997,000 $792,000 $722,000 $880,280 $854,429 $865,125 Operating Reserve Goal (% of O&M Cost) 50% $2,735,108 $2,559,810 $3,205,507 $3,140,717 $3,090,961 $3,242,260 $3,194,635 $3,215,608 $3,351,840 $3,397,149 $3,461,896 Reserve Balances Starting Balance General Operating Reserve (Excess Funds Transferred Here) $2,052,861 $2,735,108 $2,559,810 $7,198,427 $6,668,158 $5,976,751 $5,194,522 $4,402,145 $4,066,608 $3,500,937 $3,108,346 $2,824,941 Capital Reserve (Equal to Costs) n/a $7,411,269 $9,598,448 $3,991,104 $3,975,040 $4,199,832 $4,199,931 $4,448,092 $4,452,551 $4,451,142 $4,454,764 $4,458,219 R&R Reserve n/a $450,000 $450,000 $450,000 $450,000 $450,000 $450,000 $450,000 $450,000 $450,000 $450,000 $450,000 TOTAL $10,596,377 $12,608,258 $11,639,531 $11,093,198 $10,626,583 $9,844,453 $9,300,237 $8,969,159 $8,402,079 $8,013,110 $7,733,161 Check row (should equal $0) n/a n/a $0 $0 $0 $0 $0 $0 $0 $0 $0 Operating Cost and Income Items Notes/Assumptions: Enter data in green areas only. Italicized values do not feed total. Reserve information from 2016 Model and "Copy of Schedule III for rate study for 2019-2027".
North Olmsted
14
Current Loans Payments Payments Payments Payments Payments Payments Payments Payments Payments Payments Payments Purpose 2017 2018 2019 2020 2021 2022 2023 2024 2025 2026 2027 See Y0 Expenses $3,766,676 $3,831,872 $3,811,967 $3,787,958 $3,787,958 $3,787,958 $3,787,958 $3,787,958 $3,787,958 $3,787,958 Purpose Y0 Y1 Y2 Y3 Y4 Y5 Y6 Y7 Y8 Y9 Y10 Outstanding Obligations $685,801 $685,801 $87,200 $89,600 $88,200 $88,200 $88,200 $88,200 $88,200 $88,200 $88,200 OWDA 6364 $3,102,584 $3,080,875 $3,744,672 $3,722,367 $3,699,758 $3,699,758 $3,699,758 $3,699,758 $3,699,758 $3,699,758 $3,699,758 Notes/Assumptions: From 2016 Model. Edited costs from 2019-2027 using "Copy of Schedule III for rate study for 2019-2027"
15
2% 2% 2% 2% 2% Yearly Total R&R Cost $0 $0 $1,190,000 $957,000 $752,000 $947,000 $742,000 $672,000 $830,280 $804,429 $815,125 $788,222 $797,651 2017 2018 2019 2020 2021 2022 2023 2024 2025 2026 2027 2028 2029 Replacement Item Description Cost per Item in Current Dollars Useful Life (yrs) Y0 Y1 Y2 Y3 Y4 Y5 Y6 Y7 Y8 Y9 Y10 Y11 Y12 South Interceptor Improvements (Engineering) $200,000 $225,000 Sewer Lining Program $250,000 $250,000 $250,000 $250,000 $250,000 Trade in a replace Vac Truck 450-500K (trade in value 75-90K) 450-500k 10 $480,000 Modifications to HVAC Dover, Lebern 35K 35k 20 $35,000 Grinder Rebuild 25k 5 $25,000 $25,000 Rebuilding/coating manholes 45k 50 $45,000 $45,000 Re condition removed bowl from centrifuge (50K) 50k 5 $50,000 L.E.D. Lighting Upgrade (7K) 7k 10 $7,000 $7,000 $7,000 $7,000 $7,000 $7,000 Brick work North side of Zimpro (50K) Discuss with Bowen 50k 50 $50,000 Seal Parking and Drive Areas (10K) 10k 5 $10,000 E.Q. Drain Pump Spare Parts (10K) [Not Capital, 53] 10k 5 Concrete work Tersh, (50K) 50k 50 $50,000 Electrical Service 13,200 Voltage, Aluminum wiring connections & Transformers (25K) (includes 3 units) 25k 20 $25,000 $55,000 Purchase 1 Sludge hopper or screening hopper (10K) 10k 5 $10,000 Sandblast / Paint 1 Sludge Hopper (7K) [Not Capital, 54] 7k 5 Kruger Drum Rebuild Parts BEARINGS (50K) [Capital this year 53 going forward] 5 $50,000 Asbestos abatement (10K) 10k $10,000 $10,000 $10,000 Refresh roof (seal coat) (admin 2nd floor, tersh, SO2) (30K) 30k 10 $30,000 Update servers and Software, PLC replacement (75K) (create line item in 54 or 53) (talk to Keith) 10 $75,000 New Roll of truck with hook system (200K) 200k 10 $200,000 Reagent Refrigerator/ 3K 3k 10 $3,000 $80,000 Lab Remodel ½ of lab (80K) 80k 50 $80,000 Replace van #47 35k 35k 7 $30,000 Replace Dump Truck #49 40K 40k 7 $40,000 Generator replacement Bradley 30K 30k 20 $30,000 Dover LS Spare Pump $20,000 Andritz Perf Plate Chain both units (50K) 50K 5 $50,000 Sand Blast & Paint Rag & Grit Hoppers (15K) 15K 5 $15,000 R.A.S. Pump Rebuild 1 pump (25K) 25K 10 $25,000 $25,000 $25,000 Kubota replacement w/ trade-in $25,000 T.W.A.S Tanks Demo (50K) 50k 50 $50,000 New/replace maintenance vehicle with multi-use (all purpose) mobile service vehicle (125K) 125K 10 $125,000 Autosampler/ 10K 10K 15 $10,000 Glassware washer/ 15K 15K 10 $15,000 Replace CCTV truck (assumes trade in/ reuse of CCTV eq) 7 $150,000 Grinder Moen (if needed) 45k 45k 10 $45,000 Grinder Rebuild Broxbourne/Dover 5 $25,000 $25,000 $25,000 Replace standby pump at Dover (inc VFD) $50,000 Replace Vault at top of hill $70,000 Grit Pump Rebuild, 1 Pump (25K) 25k 10 $25,000 $25,000 Replace front gate and controls 50 $20,000 Replace forklift (30K) 30k 15 $30,000 Replace truck 35K 35K 7 $35,000 $35,000 $35,000 Andritz Perf Plate Chain, flights and steps 10 $25,000 Andritz Perf Plate Chain, discharge chutes 10 $20,000 GIS software and system modeling $80,000 $80,000 Roof SO 2 Building (75K) 75k 20 $75,000 Rebuild Sludge Decant Pumps 2 (30K) 30k 10 $30,000 Replace generator and building at Lebern $100,000 Andritz Perf Plate Chain, one unit $25,000 $25,000 Seal parking lot (inc Dover LS) 5 $15,000 2 R.A.S. Pump Rebuild pump (50K) 50k 10 $50,000 Replace centrifuge bowl (125K) 125k 10 $125,000 Plant drain pump replacement (50K) 50k 10 $50,000 $50,000 Replace Current Flat-bed Maintenance Crane Truck (60K) 60k 10 $60,000 Replace backhoe (asssumes transfer to fleet) 50 $100,000 Dump pit for hydro excavation $35,000 Broom attachement for Skid Stear 5 $15,000 Screw Air compressor (centrifuge supply) 10 $50,000 Notes: Costs related to repair and replacement of assets totalling less than or equal to $500,000. Information from "5 yr Cap Plan Worksheet 2020-2024" Inflated average of past five years
16
Future Loans Payments Payments Payments Payments Payments Payments Payments Payments Payments Payments Payments Payments Payments Payments Payments Payments 2017 2018 2019 2020 2021 2022 2023 2024 2025 2026 2027 2028 2029 2030 2031 2032 0% ANNUAL DEBT PAYMENT $20,842 $84,600 $87,200 $89,600 $336,932 $335,532 $582,164 $585,064 $582,064 $584,064 $585,864 $497,464 $497,464 $497,464 $248,732 $248,732 Project Cost Interest Rate (Annual %) Loan Duration (yr) Y0 Y1 Y2 Y3 Y4 Y5 Y6 Y7 Y8 Y9 Y10 Y11 Y12 Y13 Y14 Y15 Bradely Lift Station Improvements n/a n/a n/a $20,842 $84,600 $87,200 $89,600 $88,200 $86,800 $84,700 $87,600 $84,600 $86,600 $88,400 South Interceptor Improvements - 1st $2,000,000 4.50% 10 $248,732 $248,732 $248,732 $248,732 $248,732 $248,732 $248,732 $248,732 $248,732 $248,732 South Interceptor Improvements - 2nd $2,000,000 4.50% 10 $248,732 $248,732 $248,732 $248,732 $248,732 $248,732 $248,732 $248,732 $248,732 $248,732 Collection Cost Notes/Assumptions: Inflation Rate
17
19
20
21