SLIDE 1 North Carolina Health Information Portal
Esri International Users Conference Sean Finnegan, MS, Sarah Lesesne, MSPH, Mark Carrozza, MA, Michael Topmiller, MS et al. July 11, 2013
SLIDE 2
The Robert Graham Center
The American Academy of Family Physician’s Center
for Policy Research
Editorial Independence Primary Care Workforce and Maldistribution Studies Cost of Practice Transformation State level analysis for assessing health care shortages Emphasis on geography and GIS. Conduct analysis for a variety of online mapping and data display tools built by HealthLandscape L.L.C.
UDS Mapper Residency Footprinting Mapper Primary Care Physician Mapper And Many More…
SLIDE 3
Purpose
To be a catalyst and stimulate informed
conversation and choices about health and healthcare for the communities in North Carolina.
To provide a platform for Community Care of North
Carolina’s Networks, public health organizations, practices and physicians to assist in the improvement of health care delivery, outcomes and costs.
SLIDE 4
Data Sources
US Census Bureau 2010 American Community Survey 2007-2011 Robert Wood Johnson Foundation Roadmap Indicators Healthy People 2020 Health North Carolina 2020 Centers for Disease Control Behavioral Risk Factor Surveillance System
SLIDE 5
Data Sources Continued
State Medicaid and Medicare Data From all network enrolled practices Aggregated to the County, Hospital Referral Regions, and practice level Key Performance and Quality Indicators Cost and Utilization Data
SLIDE 6
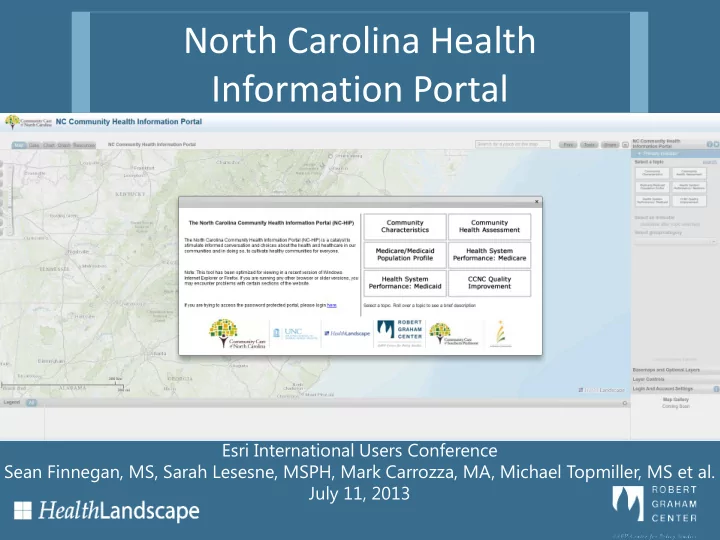
Landing Page, or Splash Screen
SLIDE 7
Mapping Poverty
SLIDE 8 Geographic Variation in Medicaid Costs
Average Monthly Medicaid Costs by County
SLIDE 9 Data Tables
Average Monthly Medicaid Costs by County
SLIDE 10 Chart
Average Monthly Medicaid Costs by County
SLIDE 11
Percent Obesity and Preponderance of Fast Food Restaurants
SLIDE 12
Percent Obesity and Preponderance of Fast Food Restaurants – Threshold
SLIDE 13
Percent Obesity and Preponderance of Fast Food Restaurants – Comparison
SLIDE 14
Practice-Level Variation in Breast Cancer Screening Rates
SLIDE 15
Training Program is Key
Users need guidance on operating these complex
mapping tools and an understanding of how to interpret the data.
In-Person Trainings Webinars Online Training and Support Materials
SLIDE 16
Resources
SLIDE 17
Conclusions
The North Carolina Health Information Portal has
allowed users to visualize data in ways that they have never been able to do before
It helps networks see where there are wide
variations in quality measures to help identifying potential areas of additional resources.
Makes the data more compelling and facilitates
discussions that can help lead to healthier communities across the state of North Carolina.
SLIDE 18
Future Work
Phase III is underway and brings more streamlined
updating of the data.
Cascading geographies with filtering options based
upon age, race, gender.
Improved training and dissemination Additional functionality
SLIDE 19
Thank you!
North Carolina Health Information Portal https://www.communitycarenc.org/nc-hip/ Sean C. Finnegan sfinnegan@aafp.org