
SLIDE 1
!!"# !!!# !!## !$%# !$&# !$"# !$!# !$## $# !# '# "# (#
Line P
CalCOFI Asia
Latitude N Longitude W
KOE NPC
NPGO SSHa pattern
North America
North Pacific Sea Level Anomalies
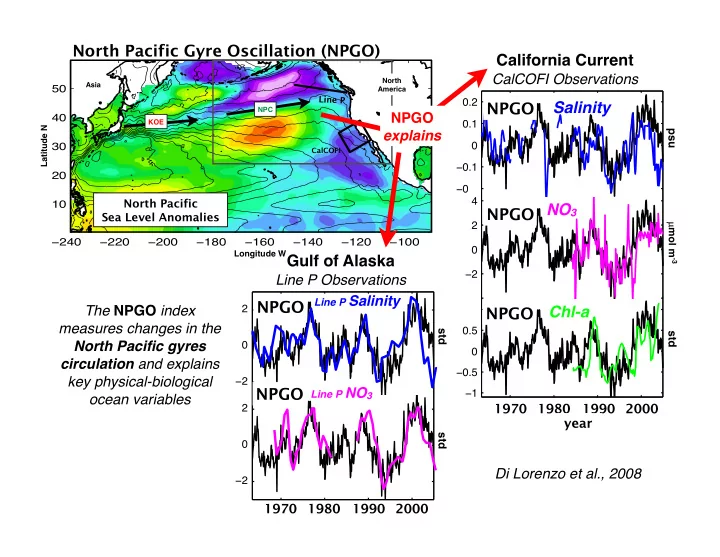
North Pacific Gyre Oscillation (NPGO)
Di Lorenzo et al., 2008
California Current
CalCOFI Observations
!"#$ !"%$ !""$ &$$$ !! !$'( $ $'( ! !'( !"#$ !"%$ !""$ &$$$ !$'& !$'! $ $'! $'& !' !& $ & '
NO3 Chl-a NPGO Salinity NPGO NPGO
1970 1980 1990 2000
psu
!mol m-3
std
year
std
Gulf of Alaska
Line P Observations
1970 1980 1990 2000
& $ & Line P Salinity Line P NO3
NPGO NPGO
std !& $ & !& $ & std
NPGO explains The NPGO index measures changes in the North Pacific gyres circulation and explains key physical-biological
- cean variables