Nigerias economy y grew by y 1.9% in the second quarter of 2019 - - PowerPoint PPT Presentation

nigeria s economy y grew by y 1 9 in the second quarter
SMART_READER_LITE
LIVE PREVIEW

Nigerias economy y grew by y 1.9% in the second quarter of 2019 - - PowerPoint PPT Presentation

Nigerias economy y grew by y 1.9% in the second quarter of 2019 Nigerias Real GDP Growth rate In the second quarter of 2019, real GDP grew by y 1. 1.9% 9%, hi higher her tha han n 1. 1.5% 5% rec ecorded ed in n 2018Q


slide-1
SLIDE 1

4,0% 2,1%

  • 2,3%

1,4% 2,4% 1,9%

  • 3,0%
  • 2,0%
  • 1,0%

0,0% 1,0% 2,0% 3,0% 4,0% 5,0% 2 1 5 Q 1 2 1 5 Q 2 2 1 5 Q 3 2 1 5 Q 4 2 1 6 Q 1 2 1 6 Q 2 2 1 6 Q 3 2 1 6 Q 4 2 1 7 Q 1 2 1 7 Q 2 2 1 7 Q 3 2 1 7 Q 4 2 1 8 Q 1 2 1 8 Q 2 2 1 8 Q 3 2 1 8 Q 4 2 1 9 Q 1 2 1 9 Q 2

Nigeria’s economy y grew by y 1.9% in the second quarter of 2019

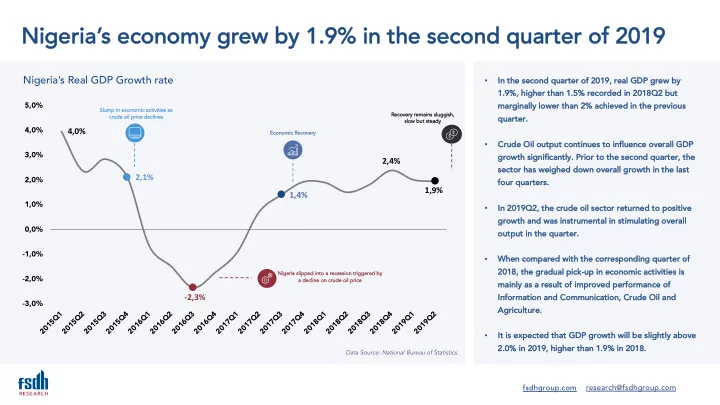
Nigeria’s Real GDP Growth rate

  • In the second quarter of 2019, real GDP grew by

y 1. 1.9% 9%, hi higher her tha han n 1. 1.5% 5% rec ecorded ed in n 2018Q 2018Q2 2 but ut marginally y lower than 2% achieve ved in the previ vious qu quarter.

  • Crude Oil output continues to influence ove

verall GDP growth significantly.

  • y. Prior to the second quarter, the

sector has weighed down ove verall growth in the last fou four quarters.

  • In 2019Q2, the crude oil sector returned to positive

ve growth and was instrumental in stimulating ove verall

  • u
  • utput in the quarter.
  • Wh

When compar ared with the corresponding quar arter of 2018, 2018, the he gradua ual pick-up in economic activi vities is mainly y as a result of improve ved performance of In Information a and C Communication, C , Crude O Oil a and Ag Agricul ultur ure. e.

  • It is expected that GDP growth will be slightly

y above ve 2. 2.0% 0% in n 2019, 2019, hi higher her tha han n 1. 1.9% 9% in n 2018. 2018.

Ec Econ

  • nom
  • mic Re

Recov

  • very

Ni Nigeri ria s slipped i into to a a re recession tri triggere red b by a a decline on crude oil price Re Recov

  • very remains sluggi

ggish, sl slow but st steady Sl Slum ump in n ec econo nomic activities es as cr crude oil price ce decl clines

Data Source: National Bureau of Statistics

fsdhgroup.com research@fsdhgroup.com

slide-2
SLIDE 2
  • 25,0%
  • 20,0%
  • 15,0%
  • 10,0%
  • 5,0%

0,0% 5,0% 10,0% 15,0% 20,0% 25,0% 30,0% 2 1 5 Q 1 2 1 5 Q 2 2 1 5 Q 3 2 1 5 Q 4 2 1 6 Q 1 2 1 6 Q 2 2 1 6 Q 3 2 1 6 Q 4 2 1 7 Q 1 2 1 7 Q 2 2 1 7 Q 3 2 1 7 Q 4 2 1 8 Q 1 2 1 8 Q 2 2 1 8 Q 3 2 1 8 Q 4 2 1 9 Q 1 2 1 9 Q 2 Oil GDP Non-Oil GDP

Nigeria’s Oil and Non-Oil GDP Growth rate

1. 1. In the second quarter of 2019, oil GDP returned to a positive ve gr growt wth of 5.2% for the first time since the first qu quarter of 2018. This is largely y as a result of increased crude oil output which ave veraged 1.98 million barrels per day y in the quarter. 2. 2. In In a addition t to o

  • il o
  • utput, t

, the b base e effect w was r responsible f for this increase, especially y give ven that oil GDP had the largest de decline of -4% 4% in n 2018Q 2018Q2. 2. 3. 3. The decline in Oil GDP was instrumental in pulling the economy y into a recession in 2016. Howeve ver, its return to positive ve growth presents a glimmer of hope and strengthens ove verall growth prospects of the economy. y. 4. 4. No Non-oi

  • il GDP has remained resilient but has experienced weak
  • growth. It grew by

y 1.6% in the second quarter of 2019. This is th the lowest t gro rowth th re record rded since 2018Q2.

Oil GDP growth has remained in the negative since 2018 Q2, but returned to positive growth in 2019Q2.

Oil GDP move vement explains Nigeria’s economic vu vulnerability

Data Source: National Bureau of Statistics

fsdhgroup.com research@fsdhgroup.com

slide-3
SLIDE 3

23% 23% 54% Agriculture Industries Services

Sectoral GDP Growth in 2019Q2

  • 3,8%
  • 3,4%
  • 2,2%
  • 0,2%
  • 0,1%

0,4% 0,7% 0,8% 1,0% 1,1% 1,2% 1,8% 1,9% 2,0% 2,5% 2,9% 5,0% 8,0% 9,0% 14,4% Real Estate Public Administration Finance & Insurance Trade Manufacturing Electricity, Gas, Steam, & AC Supply Construction Arts, Entertainment & Recreation Education Human Health & Social Services Profession, Sci. & Technical Services Agriculture Overall Growth Administrative & Support Services Other Services Accommodation & Food Services Mining & Quarrying Transportation & Storage Information & Communication Water Supply, Sewage, Waste Mgmt

  • Servi

vices remained the drive ver of GDP growth in 2018 and 2019Q2, led by y Tr Transportation & Storage and Information & Communication, although Water Supply/ y/Waste Management had the highest growth of 14.4% in 2019Q2.

  • In 2019Q2, of the 19 major sectors, 5 recorded negative

ve growth, down from 6 sectors in the previ vious quarter. Manufacturing recorded a negative ve growth for the fi first time since the third quarter of f 2017.

  • Ag

Agriculture and construction recorded modest growth in 2019Q2.

  • Trade is expected to bounce back to the positive

ve region in 2019.

  • Recent data show slow economic recove

very y amidst positive ve expectations.

Contribution to GDP - 2019Q2

Which sectors will drive ve growth in coming quarters?

Data Source: National Bureau of Statistics

fsdhgroup.com research@fsdhgroup.com

slide-4
SLIDE 4

Ni Nigeri ria’ a’s GD GDP gr grow

  • wth is expe

pected d to to b be s slightl tly a above 2% 2% in n 2019, 2019, lower er th than th the E ERGP GP ta target t

  • f
  • f 4.5%.

Gr Growth w will c continue t to b be dr driven by by the Services sector- Te Telecoms s and Tr Transp sport wi will pl play a major role in dr driving g gr

  • growth. Similarly, Oil GDP will

be be instrumental in shapi ping g

  • v
  • vera

rall GDP DP perf rform

  • rmance in

2019.

  • 2019. Agricul

ultur ure e will rem emain n re resilient, t, how

  • wever,

r, poor

  • or weath

ther r co conditions and lower pr produ ductivity are major ch challenges that co could limit gr growth.

Pr Prices es are e ex expec ected ed to re remain stable in the re remaining part of the ye year owing to exch xchange ra rate te s sta tability ty a and s sta table ag agricultural al o

  • utput.

. Ex Exchange ge Ra Rate is ex expec ected ed to rem emain n st stable largely due to st stable oil prices s and fo foreign i investm tment t in inflo lows ws. FPI FPI are e set et to be e hi higher her tha han n the he US US$12.2 billio illion re record rded in 2018. Mo Money market in instruments will will co continue to acco ccount fo for an r an i increas asing sh share of inflows. s. Ba Banking, Manufacturing, Mi Mining and Quarrying, an and t the T Technology se sectors s are expected to ac account fo for t the l lar argest sh share of FDI inflows s in 2019. 2019.

Go Government policies, re reforms and expenditure re pl plans will have sign gnificant po positive impa pact on the ec econo

  • nomy. Howev

ever er, we e ma may continue to ex exper erienc ence e reg egul ulatory “t “tightness” ” from fiscal al an and mo monetary authorities, wh which may limit growt wth.

The economy y is expanding- slowly y but steadily

fsdhgroup.com research@fsdhgroup.com