New Zealand A robust business model George Adams 16-17 October - - PDF document

new zealand a robust business model
SMART_READER_LITE
LIVE PREVIEW

New Zealand A robust business model George Adams 16-17 October - - PDF document

Investor Tour New Zealand New Zealand A robust business model George Adams 16-17 October 2008 1 The New Zealand business is in growth and is resilient sales revenue has tripled and volume decreased in only 2 of the past 15 years


slide-1
SLIDE 1

1

Investor Tour – New Zealand

New Zealand A robust business model

George Adams 16-17 October 2008

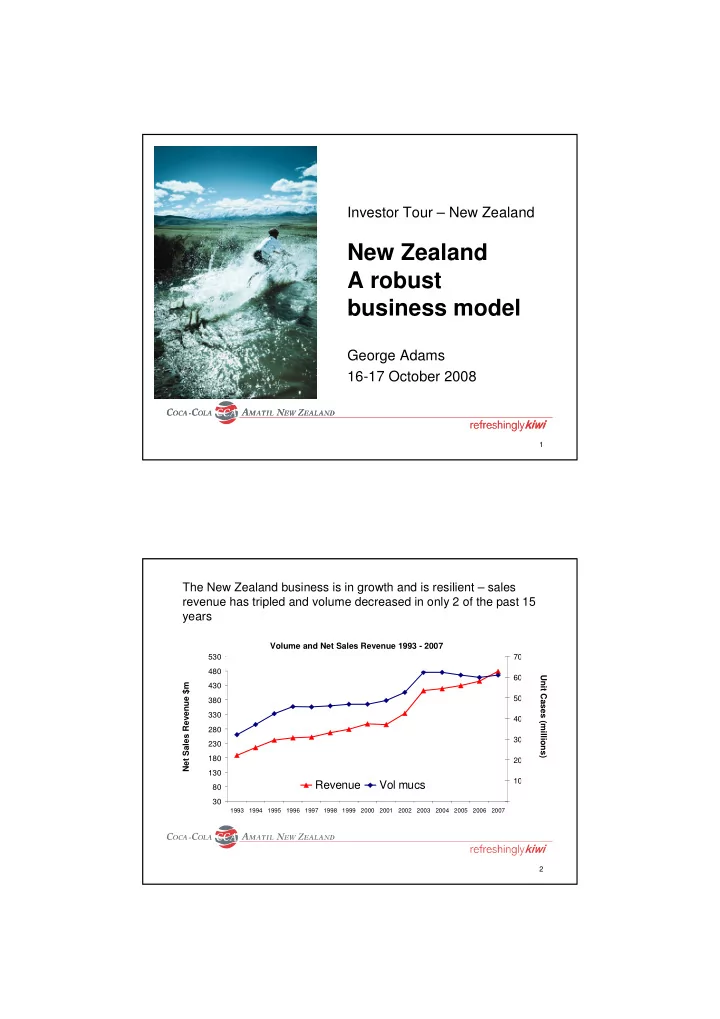
2 30 80 130 180 230 280 330 380 430 480 530

1993 1994 1995 1996 1997 1998 1999 2000 2001 2002 2003 2004 2005 2006 2007

Net Sales Revenue (NZD $m) 10 20 30 40 50 60 70 Unit Cases (millions)

Revenue Vol mucs The New Zealand business is in growth and is resilient – sales revenue has tripled and volume decreased in only 2 of the past 15 years

Volume and Net Sales Revenue 1993 - 2007 Net Sales Revenue $m Unit Cases (millions)

slide-2
SLIDE 2

3

The improvement in earnings has been driven by revenue management initiatives, recovery of COGS increases and efficiencies from capital investments

17.7% 16.9% 23.1% 17.4%

  • 20%
  • 15%
  • 10%
  • 5%

0% 5% 10% 15% 20% 25% 30% H1 H2 H1 H2 H1 2006 2007 2008 % Growth Record local currency earnings +20.4% Local Currency EBIT Growth 4

CCA remain on track to deliver a record result in NZ in 2008 – despite the softer H2 macro environment

Source: Westpac Q3 Consumer Confidence Survey - September 24 2008

slide-3
SLIDE 3

5

CCA has a strong market position especially in CSDs

100% 80% 60% 40% 20% 0% Juice Water CSD Energy Sports Milk

Total NARTD Market by Volume (Jun-08)* CCA Frucor Private Label Other

* Areas in the above diagram are indicative only

Market Size Market Share 6

Significant CSD initiatives will drive EBIT growth over the next few years

% Contribution to EBIT Growth 2008 – 2010 Key Drivers of EBIT Growth CSD Non CSD Alcohol & Coffee Project Zero

25% 30% 20% 25%

slide-4
SLIDE 4

7 2005 2008 2008

At 18% of volume, multi-pack can CSD volumes are small relative to Australia (at 44%) and are a major growth opportunity

New Zealand Australia

Cans % Grocery CSD (Volume)

15% 18% 44%

8

Momentum is building with multi-pack can growth accelerating

Launched Progressive 30 pack and Foodstuffs 24 pack in 2008 Multi-pack can reset completed in Progressive and Foodstuffs

slide-5
SLIDE 5

9

Cold drink availability expansion in Grocery is significant

10 % Contribution to EBIT Growth 2008 – 2010 Key Drivers of EBIT Growth CSD Non CSD Alcohol & Coffee Project Zero

25% 30% 20% 25%

Significant Non-CSD initiatives will drive EBIT growth over the next few years

slide-6
SLIDE 6

11

The Energy category is 4 times larger in New Zealand relative to Australia – the opportunity is significant

Retail Market Value Energy NZ$230m Retail Market Value Energy A$700m

12

And with the launch of Relentless CCA is beginning to become a significant energy player with 21.2% share of the energy category

2,000 dedicated energy cooler doors in 1H 2009 New Zealand’s No.2 energy brand Large pack energy 440ml Relentless

slide-7
SLIDE 7

13

And momentum will be fuelled by the launch of a second flavour

  • ‘Relentless Inferno’

Juice based energy hit!

14

The launch of Glacéau and PUMPED will tap the health and wellbeing trend and further build premium in the water category

29.1%

Pump value share of Water category MAT Sep-08

27.3%

Leveraging the existing brand strength of PUMP New product launch

slide-8
SLIDE 8

15

0.0 0.5 1.0 1.5 2.0 2.5 2005 2007

Unit Cases (millions)

New Zealand Powerade per capita consumption now exceeds Australia and has grown by 35% between 2005 - 2007

35% CAGR 2 4 6 8 10 12 14 2000 2001 2002 2003 2004 2005 2006 2007

Australia New Zealand Powerade Volume Growth Powerade Consumption Per Capita

Key growth drivers:

  • Isotonic launch
  • All Blacks promotional activity
  • Flavour variants
  • Multi- packs to come

16 % Contribution to EBIT Growth 2008 – 2010 Key Drivers of EBIT Growth CSD Non CSD Alcohol & Coffee Project Zero

25% 30% 20% 25%

Significant Alcoholic Beverage and Coffee initiatives will drive EBIT growth over the next few years

slide-9
SLIDE 9

17

Café Direct was acquired in March 2007 doubling the EBIT contribution from the vending business

  • B2B free-vend coffee provider
  • Margin on consumables
  • 40% market share
  • 1200 outlets and 1500 machines
  • Integrated with vending operations
  • Hot beverage 12% of Convenience &

Leisure value (RTD)

18

The launch of premium beer and Jim Beam ready-to-drink manufacturing is growing new earnings streams

Manufacture of Jim Beam RTD commenced in September 2007 Pacific Beverages NZ has already captured 4% of the premium beer category*

*Source ACNeilsen scan Quarter to Sep-08

slide-10
SLIDE 10

19

Product innovation and brand development is the key to CCA’s differentiation and driver of the continued volume growth of alcoholic beverages

VOL % SHARE VOL % SHARE VOL RANK MANUFACTURER (Aug 08 YTD) +/- YA VOL % CHG YA 1 LION NATHAN 48.8

  • 0.2

20.8 2 DB BREWERIES 33.3

  • 2.6

12.4 3 INDEPENDENT LIQUOR 10.9 2.2 52.9 4 COCA-COLA AMATIL NZ LTD 1.8 1.7 5520.7 5 FOSTERS 1.8 0.1 26.2 ALL OTHER 3.5

  • 1.2
  • 10.1

Source : Grocery AC Nielsen

20 % Contribution to EBIT Growth 2008 – 2010 Key Drivers of EBIT Growth CSD Non CSD Alcohol & Coffee Project Zero

25% 30% 20% 25%

Significant Project Zero initiatives will drive EBIT growth over the next few years

slide-11
SLIDE 11

21

Project Zero: Auckland distribution centre delivers capacity until 2020 with reduced costs and improved customer service

Auckland DC - Commissioned May 2008

  • Capital investment NZ$80m
  • 27% increase in pick rates
  • 1.7% improvement in pick accuracy
  • 9% improvement in customer service scores
  • 30% reduction in fleet movements

22

Project Zero: 2009 initiatives will focus on manufacturing efficiency, SAP implementation and cost-to-serve reduction opportunities

Auckland Can Line Upgrade Leveraging our infrastructure investment Hotfill Capability Enterprise and manufacturing efficiency

slide-12
SLIDE 12

23

2nd 2nd 1st 2nd 1st 1st 1st 1st

2007

1st No Entry No Entry No Entry

Best Customer Service Outbound

  • 1st

No Entry 3rd 10th 4th 18th

2005

1st 1st No Entry 2nd 8th 7th 1st

2006

1st No Entry

Overall Supreme Best Customer Service

tba 3rd

PEL Supplier of the Year

Grocery

3rd 1st

Coalface Petro HO

C&L

2nd 2nd

Coalface Petro Store

1st No Entry

Best Customer Service Inbound

Customer Contact Centre

tba

  • NARGON Best

Supplier

5th 4th

Coalface Route

2008 2004

Awards Project Zero: CCA’s investment in customer service is delivering results with the business regularly receiving best supplier in category awards

24

Priorities for 2009 are:

  • Revenue management initiatives to ensure recovery of COGS

increases

  • Leveraging asset base to deliver efficiencies and increasing

capacity

  • Further develop the CSD multi-pack can strategy
  • Grow energy market share
  • Develop premium water offerings (Glacéau / Pumped)
  • Alcoholic beverages – increase in customer and brand availability