New Challenge 10 New Challenge 10 June 1, 2007 Business - - PDF document

new challenge 10 new challenge 10
SMART_READER_LITE
LIVE PREVIEW

New Challenge 10 New Challenge 10 June 1, 2007 Business - - PDF document

New Challenge 10 New Challenge 10 June 1, 2007 Business environment Direction Challenge Business environment Direction Challenge Changing insurance market Changing insurance market Saturated non-life market Improve quality from


slide-1
SLIDE 1

June 1, 2007

New Challenge 10 New Challenge 10

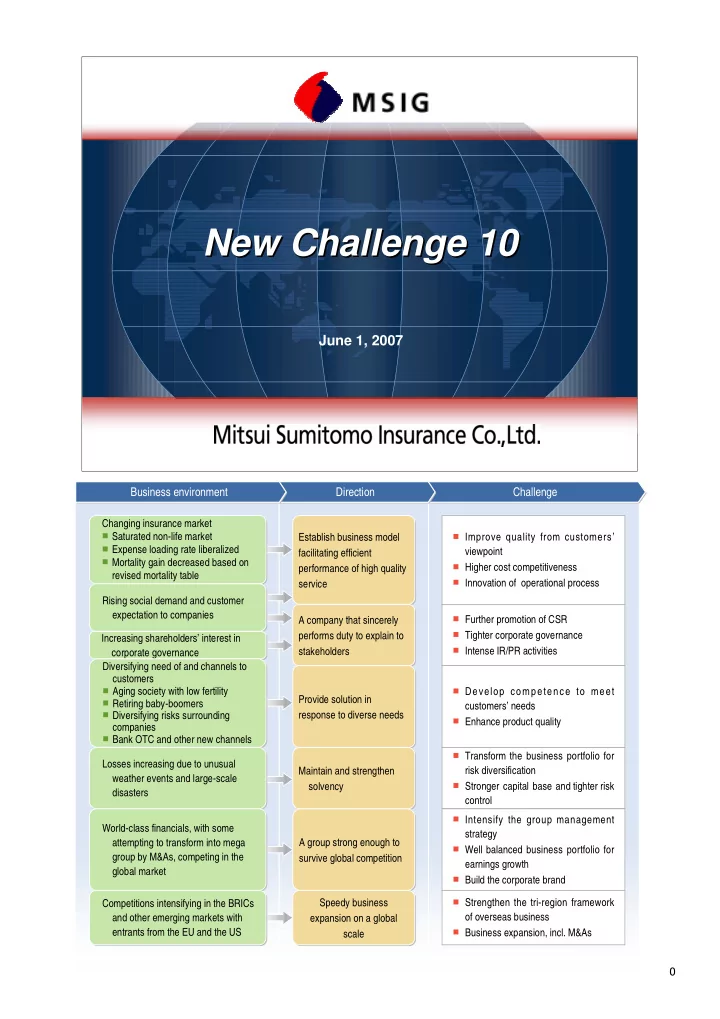
Improve quality from customers’

viewpoint

Higher cost competitiveness Innovation of operational process

Establish business model facilitating efficient performance of high quality service Establish business model facilitating efficient performance of high quality service A company that sincerely performs duty to explain to stakeholders A company that sincerely performs duty to explain to stakeholders Provide solution in response to diverse needs Provide solution in response to diverse needs Maintain and strengthen solvency Maintain and strengthen solvency A group strong enough to survive global competition A group strong enough to survive global competition Speedy business expansion on a global scale Speedy business expansion on a global scale

Further promotion of CSR Tighter corporate governance Intense IR/PR activities Develop competence to meet

customers’ needs

Enhance product quality Transform the business portfolio for

risk diversification

Stronger capital base and tighter risk

control

Intensify the group management

strategy

Well balanced business portfolio for

earnings growth

Build the corporate brand Strengthen the tri-region framework

  • f overseas business

Business expansion, incl. M&As

Challenge Challenge Direction Direction Business environment Business environment

Changing insurance market

Saturated non-life market Expense loading rate liberalized Mortality gain decreased based on

revised mortality table Changing insurance market

Saturated non-life market Expense loading rate liberalized Mortality gain decreased based on

revised mortality table Rising social demand and customer expectation to companies Rising social demand and customer expectation to companies Increasing shareholders’ interest in corporate governance Increasing shareholders’ interest in corporate governance Diversifying need of and channels to customers

Aging society with low fertility Retiring baby-boomers Diversifying risks surrounding

companies

Bank OTC and other new channels

Diversifying need of and channels to customers

Aging society with low fertility Retiring baby-boomers Diversifying risks surrounding

companies

Bank OTC and other new channels

Losses increasing due to unusual weather events and large-scale disasters Losses increasing due to unusual weather events and large-scale disasters World-class financials, with some attempting to transform into mega group by M&As, competing in the global market World-class financials, with some attempting to transform into mega group by M&As, competing in the global market Competitions intensifying in the BRICs and other emerging markets with entrants from the EU and the US Competitions intensifying in the BRICs and other emerging markets with entrants from the EU and the US

slide-2
SLIDE 2

1

1

New Challenge 10 : Basic Group Strategy

CSR-oriented management through quality improvement originating from customers’ viewpoint, trust and growth CSR-oriented management through quality improvement originating from customers’ viewpoint, trust and growth

1 1 1

Improve quality of products and services as first priority Improve quality of products and Improve quality of products and services as first priority services as first priority

Trust Trust Trust 2 2 2

Eearn trust from a wider range

  • f customers, develop trust

gained so Eearn trust from a wider range Eearn trust from a wider range

  • f customers, develop trust
  • f customers, develop trust

gained so gained so

Growth Growth Growth 3 3 3

Re-invest mgmt resources increased during growth Re-invest mgmt resources Re-invest mgmt resources increased during growth increased during growth

Quality

improvement

Quality Quality

improvement improvement

For all the things you care about For all the things you care about

Corporate message Keep the virtuous cycle from Keep the virtuous cycle from 1 1to to 3 3 going round for going round for sustainable quality improvement sustainable quality improvement

Corporate quality improvement Corporate quality Corporate quality improvement improvement Build corporate brand Build corporate brand Build corporate brand New Challenge 10 Position

Corporate Mission Corporate Mission

Charter on Professional Conduct Charter on Professional Conduct

Corporate message Corporate message Basic group strategy Basic group strategy Quality improvement strategy Quality improvement strategy Group business strategy Group business strategy Specific challenges in the 5 core businesses Specific challenges in the 5 core businesses Shain Hatsuratsu nurturing / Strengthening management base Shain Hatsuratsu nurturing / Strengthening management base New Challenge 10 New Challenge 10

CSR-oriented management through quality improvement originating from customers’ viewpoint, trust and growth CSR-oriented management through quality improvement originating from customers’ viewpoint, trust and growth Implement 3 quality improvement strategies, Demonstrate group total power in the 5 core businesses Implement 3 quality improvement strategies, Demonstrate group total power in the 5 core businesses

Seek quality improvement and business promotion each business domain Seek quality improvement and business promotion each business domain

Human resources development, job satisfaction, comfortable workplace, corporate governance, branding strategy, etc. Human resources development, job satisfaction, comfortable workplace, corporate governance, branding strategy, etc. Basic group strategy < desirable quality and outstanding quality >

Desirable quality Desirable quality Quality on a service level that customers find satisfactory Quality on a service level that customers find satisfactory Outstanding quality Outstanding quality Quality satisfying even customers’ sub-conscious need or quality on a service level far beyond customers’ expectation Quality satisfying even customers’ sub-conscious need or quality on a service level far beyond customers’ expectation Yesterday’s outstanding quality level may no more be today’s one as customers’ need is changing ceaselessly. Yesterday’s outstanding quality level may no more be today’s one as customers’ need is changing ceaselessly. Sustainably pursue outstanding quality level Sustainably pursue outstanding quality level

slide-3
SLIDE 3

2

2

New Challenge 10 : Quality Improvement Strategy

Customers’ complaints received and comments returned on

surveys

Employee comments sent on the intranet and returned on surveys Proposals raised in the Meet-the-Management campaign and by

the Council on Promotion of Customers' Viewpoint

Stakeholders’ comments received in other channels

Reflect a wide range of stakeholders’ comments Reflect a wide range of stakeholders Reflect a wide range of stakeholders’ ’ comments comments

Changes fundamentally the employee training program and the

systems of personnel transfer and evaluation

Re-program the agent training according to basic cycle of insurance Help employees and agents individually develop their capabilities

Development of employees and agents Development of employees and agents Development of employees and agents

Improve business process based on dramatic review Make visitor- and employee-friendly office environment Streamline the logistics process, etc.

Improvement of business process and infrastructure Improvement of business process and infrastructure Improvement of business process and infrastructure

Apply these three as bases in every business process for quality improvement Apply these three as bases in every business process for quality improvement

Quality improvement strategy

< reflect a wide range of stakeholders’ comments >

Customer Service Dept. established to centralizes complaint handling;

22,037 complaints received in fiscal 2006

Claims Handling Consulting Section opened within the said dept to handle requests of

advice and complaints related to claim payment; 5,912 contacts received in fiscal 2006

Customer Service Department, Claims Handling Consulting Section Customer Service Department, Claims Handling Consulting Section

Proposals and suggestions from employees posted on the intranet board;

1,560 cases since last July to date

Suggestions from MSA (nationwide organization of the agents); 8,742 cases since last July to date

Corporate Quality Control and Customer Service Depts sent survey sheets enclosed with

policy certificate; 8,540 sheets returned in fiscal 2006

Made by Claims Administration Dept upon payment; 9,489 cases returned in fiscal 2006 A panel to raise to the BoD proposals related to analysis on customers’ comments,

customer protection and/or customers’ benefits; has met 3 times to date

Council on Promotion of Customers' Viewpoint Council on Promotion of Customers' Viewpoint

  • No. 1 Information Corner,

Suggestions from MSA

  • No. 1 Information Corner,

Suggestions from MSA Survey to new / renewal policyholders, Customer survey Survey to new / renewal policyholders, Customer survey

Chairman, President and Executives at Home Office exchanged opinions directly with

employees in various positions at each branch office; 120 meetings in fiscal 2006, scheduled to continue

Meet-the-Management campaign Meet-the-Management campaign

slide-4
SLIDE 4

3

3

  • Innovations in the whole business-process (all the services facing customers):
  • Start with offering “desirable quality” and then pursue “outstanding quality”
  • Secure reasonable premium margin
  • Implement the investment management strategy

New Challenge 10 : Group Business Strategy

Life insurance business Overseas business Financial services business

  • MS Kirameki:

Business process innovation in linkage with the domestic non-life business

  • MSI MetLife:

Reinforce the sales assistance system in sight of 1-trillion-yen annual sales

  • Establish regional holding companies in Asia, Europe and the Americas with power decentralized to

each for each regional operation

  • Build an overwhelming business base in Asia: proactively invest in the strategic local markets
  • Strengthen development of financial service products and promote sales thereof

Risk-related business

  • Work to increase competitiveness of the insurance businesses
  • Develop new business for group earnings growth

Domestic non-life insurance business corporate governance, corporate governance, corporate brand, corporate brand,

Strengthen mgmt base

Strengthen mgmt base legal compliance, risk control

legal compliance, risk control

Increase corporate value of the Group Increase corporate value of the Group Increase corporate value of the Group

innovations in the areas of products, sales, claims handling, operations and systems On establishing the Audit Committee in September 2006, MSI has made it that the majority members of

Nomination Committee, Remuneration Committee and Audit Committee consist of outside directors,as well as respective chairperson.

While maintaining transparency in management, we will seek for a management system prepared to optimize

total group power as the group business expands. Corporate governance Corporate governance Corporate governance In New Challenge 10, specific measures are to be carried out for quality improvements and business promotion in each of the 5 core domains, turning an integral group power.

*MSI identifies the 5 businesses as a core domain of the Group in the insurance and financial service market

Demonstrate total power and offer service of utmost value Implement a well-balanced business portfolio

Domestic non-life Risk-related Overseas Financial services Life insurance

Group business strategy Group business strategy

Strengthen operative base for supporting quality Strengthen operative base for supporting quality improvement and growth of group business improvement and growth of group business

Risk control / legal compliance Risk control / legal compliance

Being essential to earning customers’ trust, the compliance system will be upgraded for thorough enforcement

(by re-organizing the Compliance Dept with reinforcement of 167 persons).

Will upgrade the systems for group-wide risk control and enhance transparency in management. Also we will

maintain the system, well prepared to report reliable financial data in order to earn customers’ trust.

slide-5
SLIDE 5

4

4

Y64.7 bn

New Challenge 10 : Numeric Targets

Mar-2011 business portfolio outlook Mar-2011 business portfolio outlook Mar-2011 numeric targets Mar-2011 numeric targets

Domestic non-life 62% Life insurance 17% Overseas 18%

Risk-related

Domestic non-life 55% Overseas 20% Life insurance 20%

Financial services

3%

Risk-related Financial services

5% Y100 bn

  • r more

Y100 bn or more

GCP GCP

5.0% or over

Group ROE Group ROE

Y1,650 bn or more

Consolidated net premiums written Consolidated net premiums written

Y1,370 bn or more

Stand-alone net premiums written Stand-alone net premiums written

95.0% or under

Combined ratio Combined ratio

Earnings growing upon in each business; Earnings growing upon in each business;

Quality improvement Business expansion Strategic investment

Y19,000 Nikkei Average 115 yen/$ JPY/USD rate 2.2% 10-yr JGB yield

assumptions

Critical benchmarks for business development are set in absolute figures, not by the relative ranking in comparison with peers in the industry.

Target Target policies unchanged

Distribution to shareholders, reduction

  • f stocks held

Distribution to shareholders, reduction

  • f stocks held

Will seek business expansion through reinvestment in the overseas and life insurance businesses, while securing stronger solvency Will seek business expansion through reinvestment in the overseas and life insurance businesses, while securing stronger solvency Fiscal 2006 results Fiscal 2006 results Fiscal 2010 planned Fiscal 2010 planned Group core profit (GCP) Group core profit (GCP) GCP GCP

Previous mid-term plan Previous mid-term plan Previous mid-term plan

Y64 bn

Y12,500 Nikkei Average 110 yen/$ JPY/USD rate 2.3% 10-yr JGB yield assumptions

Y100 to 120 bn

GCP

Fiscal 2010 planned Domestic non-life Y50.5 bn (79%) Life insurance Y4.0 bn (6%) Overseas Y8.6 bn (14%)

Financial services + risk-related Y0.9 bn (1%)

Domestic non-life (55%) Overseas (20%) Life insurance (20%)

Financial services + risk-related (5%)

GCP

Fiscal 2003 results

1st Growth rate of net premiums written Growth rate of net premiums written 2nd Stand-alone net premium written Stand-alone net premium written 1st Overseas gross premiums and net income Overseas gross premiums and net income 1st Life subsidiary’s net income Life subsidiary’s net income 1st Combined ratio Combined ratio 1st Rate of investment return Rate of investment return 7% Group ROE Group ROE

7 core strategic targets

slide-6
SLIDE 6

5

5

Y64.9 bn 3.08% Y1,499.2 bn (1.5%) Y1,367.4 bn (-1.0%) 93.9% Y68.1 bn 3.03% Y1,533.0 bn (2.7%) Y1,370.0 bn (0.2%) 97.1% Y1,324.4 bn (-1.0%) Y1,315.0 bn (-0.7%) Y100 bn or more 5.0% or more Y1,650 bn or more

  • 95.0% or less

Y1,370.0 bn or more

New Challenge 10 : Road to Numeric Target

Fiscal 2006 results Fiscal 2006 results Fiscal 2007 planned Fiscal 2007 planned

GCP GCP GCP-based ROE GCP-based ROE Consolidated net premiums written (growth rate) Consolidated net premiums written (growth rate) Stand-alone direct premiums written (growth rate) Stand-alone direct premiums written (growth rate)

Fiscal 2010 targets Fiscal 2010 targets

Stand-alone net premiums written (growth rate) Stand-alone net premiums written (growth rate) Combined ratio Combined ratio

* Stand-alone net premiums written will decline fiscal 2007 due to decreasing intergroup reinsurance transactions. (The decline of reinsurance income will result from retentions increasing at the subsidiaries, which will have no impact on consolidated net premiums written.) ** Stand-alone direct premiums written, which represent sales performance of the agents, will stay on the level fiscal 2007 after integration and elimination of high-loss-making agents. *** Stand-alone direct premiums written are expected to rebound fiscal 2008 and increase 1.0% annually.

GCP by business segment

Fiscal 2006 results Fiscal 2007 planned Fiscal 2010 targets Domestic non-life 40.1 (62%) 43.7 (64%) 55.0 or more (55%) Overseas 11.7 (18%) 15.6 (23%) 20.0 or more (20%) Life insurance 11.4 (17%) 8.5 (12%) 20.0 or more (20%) Financial services + risk-related 1.7 (3%) 0.3 (1%) 5.0 or more (5%)

(Y bn)

slide-7
SLIDE 7

6

6

Domestic Non-life : Business Process Innovation Domestic Non-life : Business Process Innovation

  • peration and system innovation
  • peration and system innovation
  • peration and system innovation

Product reform Sales activity reform Sales innovation Claims handling innovation Human resources reform Claims handling reform Sales channel reform, Agents’ activity reform Claims handling innovation Claims handling innovation Claims handling innovation Sales innovation Sales innovation Sales innovation Product innovation Product innovation Product innovation Shain Hatsuratsu employee nurturing Business process innovation

Previous long-term vision

New Challenge 10 New Challenge New Challenge 10 10

Operational innovation System architecture reform

slide-8
SLIDE 8

7

About 15 (about 80% to be retired) About 700 (about 50% to be abolished)

68 About 1,400 As of Mar 2009 As of Mar 2009

7

Product quality improvement Product quality Product quality improvement improvement Products easy to understand Products easy to Products easy to understand understand

Implemented fiscal 2007 To be finished within fiscal 2008 To be applied to new policies To work in place April 2008 To be implemented in 2007 when it comes available (partially implemented)

Offer products easy for customers to understand, by streamlining the existing lineup

and developing products easy to understand

Incorporate the functions necessary to meet customers’ need in the integrated

products, reorganize product lines

Minimize use of technical terms of insurance by paraphrasing Start the revision with the pamphlets to customers Analyze those factors which make the text of a policy difficult to understand, and

eliminate such factors in the text of a new policy.

Build a system for centralized and cross-line data control in respect of authorized

product features, pamphlets, policy clauses, application forms as well as for the use

  • f cross-divisional check on them

Share product information with the claims handling system to facilitate quick and

accurate claims service

Prepare a policy certificate in a layout easy to understand the features With a list of eligible claims Make policy information available on the corporate website to the policyholder

Domestic Non-life : Product Innovation

Objective Objective Objective

Theme Theme

1 1 1

Streamline the product lineup Streamline the product lineup

2 2 2

Paraphrase the technical terms into “terms easy to understand” Paraphrase the technical terms into “terms easy to understand”

3 3 3

Revise texts of policies into easier expression Revise texts of policies into easier expression

4 4 4

Construct the “Product Control System” Construct the “Product Control System”

5 5 5

Certificate with a summary and list

  • f eligible claims according each

policy, info also available on the Web Certificate with a summary and list

  • f eligible claims according each

policy, info also available on the Web

Measures in summary Measures in summary Schedule Schedule

Cross-divisional efforts to make for “products easy to understand” and “better quality” Cross-divisional efforts to make for Cross-divisional efforts to make for “ “products easy to understand products easy to understand” ” and and “ “better quality better quality” ”

Industry-first

Objectives, examples in the product innovation

Revise clauses into easy terms to understand Revise clauses into easy terms to understand Build the Product Control System Build the Product Control System At-a-glance, online services of policy and list of eligible claims At-a-glance, online services of policy and list of eligible claims

Shorten sentences, avoid parenthesized phrases, eliminate double negation, etc.

Text simplification Text simplification

Put more charts and calculation formulas, cautionary footnotes, etc. in the materials

Visualization Visualization

Collectively preserve all documents such as pamphlets, policies and applications

Document archive Document archive

Provide related information for quick and accurate payment

Claim payment support Claim payment support

Gather and oversee all product data, inclusive of permits, across the product lines Product information administration Product information administration Institute a system for inter-divisional check and authorization in the process of product development

Process control of product development Process control of product development

On each certificate, the product features are written in an at-a-glance layout with marks indicating “yes” or “no” in accordance with the particular policy.

At-a-glance policy layout At-a-glance policy layout

Eligible claims are listed according to the particular policy

List of eligible claims List of eligible claims

A policyholder may refer to our website on the Internet for the product features of his/her policy.

Online service Online service

Streamline the existing lines Streamline the existing lines Paraphrase into “words easy to understand” Paraphrase into “words easy to understand”

Fiscal 2006 Fiscal 2006 # of insurance products # of insurance products # of extra riders # of extra riders

* With regard to personal lines products

“change” “endorsement” after after before before Ex.1 Ex.1 “(property, etc.) covered” “subject of insurance” Ex.2 Ex.2 “to pay for (loss, etc.)” “to indemnify” Ex.3 Ex.3

slide-9
SLIDE 9

8

8

Ensure practices according to Ensure practices according to the basic cycle of insurance the basic cycle of insurance

Domestic Non-life : Sales Innovation

Sales innovation Sales innovation Sales innovation Build a network of agents which are able to perform duty to explain to customers by ensuring practices according to the “basic cycle of insurance.” Build a network of agents which are able to perform duty to explain to customers by ensuring practices according to the “basic cycle of insurance.” Basic cycle of insurance Basic cycle of insurance

  • Strengthen education together with strict instructions to

the agents, promote a quality improvement campaign

  • Strengthen education together with strict instructions to

Strengthen education together with strict instructions to the agents, promote a quality improvement campaign the agents, promote a quality improvement campaign

  • Upgrade the sales infrastructure from customers’ view

point

  • Upgrade the sales infrastructure from customers

Upgrade the sales infrastructure from customers’ ’ view view point point

  • Promote the sales network reform
  • Promote the sales network reform

Promote the sales network reform

Accurately complete an application form based

  • n an applicant’s intent

Ensure the applicant’s own signing and affixing

family stamp

Explain payment methods to the customer,

leaving the choice to him/her for convenience

Accurately complete an application form based

  • n an applicant’s intent

Ensure the applicant’s own signing and affixing

family stamp

Explain payment methods to the customer,

leaving the choice to him/her for convenience Give an explanation of material facts without fail in each and every case of signing, etc. Give an explanation of material facts without fail in each and every case of signing, etc. Recommend a policy that fits a customer’s risk or need, with giving an appropriate explanation, etc. Recommend a policy that fits a customer’s risk or need, with giving an appropriate explanation, etc. Ensures maturity notice to each holder of a policy maturing soon, etc. Ensures maturity notice to each holder of a policy maturing soon, etc. Properly and without fail register any change on the policy upon a notice from a policyholder, etc. Properly and without fail register any change on the policy upon a notice from a policyholder, etc. Policy maintenance and administration Policy maintenance and administration Maturity notice, renewal advice Maturity notice, renewal advice Solicitation, need identification Solicitation, need identification Offer, explanation, quotation Offer, explanation, quotation Explanation of material facts Explanation of material facts Signing, declaration Signing, declaration

Premium collection Accident Accident Reporting Reporting

Confirmation of intent Confirmation of intent

Add a function of receiving notices of change to the customer center for customers’ convenience Proper and quick response to an accident, including use of the agency computer system for

reporting

Give education and training to agents to explain and propose a product that fits a customer’s

need

Ensure confirmation of applicant’s intent

Quality improvement

Shikkari Kakunin!! movement Shikkari Kakunin!! movement

Instruct agents to accurately complete an application form and input data

Accurate registry Accurate registry

Issue a quality improvement report to the all agents every month The report contains measurement of practice on each step of sales activity by numeric indicator

Concrete education and guidance Concrete education and guidance

Monitor use level of the computer system in each step every month Mobilize the guidance system with about 60 computer system users’ assistants across the

country

More and better use the agency computer system More and better use the agency computer system

Sales infrastructure

Streamline the lines, design products easy to understand (product innovation)

Review on products Review on products

Make more methods available, credit cards acceptable to the Mobile MS1 terminal

Premium collection Premium collection Notice of change and accident report Notice of change and accident report

Electronic registry (paperless signing without affixing family stamp by use of personal computer) Link the 20 million customer contract data base with the agency computer system

Innovative signing procedures Innovative signing procedures

slide-10
SLIDE 10

9

9

Domestic Non-life

Sales Innovation : Sales Network Reform

Sales network reform Sales network reform Sales network reform

Build a network of agents which are able to perform duty to explain to customers and contribute themselves to our earnings growth Build a network of agents which are able to perform duty to explain to customers and contribute themselves to our earnings growth

Top-tier Mid-tier Small-scale tier

Conceptual diagram of sales network reform Conceptual diagram of sales network reform

With employees and agents united in With employees and agents united in

Practices according to basic cycle of insurance Practices according to basic cycle of insurance

Performing agents Performing agents Failing agents Failing agents

A network made of high quality agents which are able to perform duty to explain to customers and contribute themselves to our earnings growth

Top-tier Mid-tier Small-scale tier

Quality improvement campaign Quality improvement campaign

Foster them to be a core agent Foster them to be a core agent Larger grown Larger grown High quality agents High quality agents

Newly

  • pen

Newly

  • pen

Those performing unsatisfactorily Those performing unsatisfactorily Integration or dismissal Integration or dismissal Agents failing to perform basic cycle of insurance Agents failing to perform basic cycle of insurance Give further education and guidance and enforce to perform Give further education and guidance and enforce to perform

# of agents - new, dismissed and total

Fiscal 2003 Fiscal 2004 Fiscal 2005 Fiscal 2006 New 3,195 3,049 2,740 1,583 Dismissed 6,609 6,893 7,637 6,563 Total at fiscal year-end 66,380 62,536 57,639 52,659 Annual change

  • 3,414
  • 3,844
  • 4,897
  • 4,980

Agents equipped with MS1 38,455 37,389 36,917 35,000 Weight of equipped agents 57.9% 59.8% 64.0% 66.5%

MS1 = Agency-Company computer Intra-net system Premium coverage rate of the agent equipped with MS1 = 83.2%

(= premiums of general policy lines earned by the equipped agents / total premiums of genera policy lines earned by the all agents)

* Excluding those earned by the agency channels of convenience stores

Large-scale agents’ premium coverage rate

Agents

Premium of general lines

within top 10% 74% within top 30% 91%

* Results as of March 31, 2007

slide-11
SLIDE 11

10

10

Domestic Non-life

Sales Innovation : Approach to New Channels

Approaches to bank OTC and Japan Post privatization Approaches to bank OTC and Japan Post privatization

banks banks

Policy products currently permitted to sell

Non-life insurance Personal fire Personal property,

  • ther than fire

Personal liability Life insurance Group credit life Personal annuity

(variable, fixed)

Single premium whole

life, endowment

Installment endowment

The rest of policy lines to be permitted on Dec 22, 2007 Policy products currently permitted to sell

Non-life insurance Personal fire Personal property,

  • ther than fire

Personal liability Life insurance Group credit life Personal annuity

(variable, fixed)

Single premium whole

life, endowment

Installment endowment

The rest of policy lines to be permitted on Dec 22, 2007

Yubin-kyoku post office Yubin-kyoku post office

Upon privatization

(agent) auto insurance

Post-privatization

life insurance to corporate clientele, variable annuity

Upon privatization

(agent) auto insurance

Post-privatization

life insurance to corporate clientele, variable annuity

Yucho postal saving bank Yucho postal saving bank

Post-privatization

Intermediary or broker of variable annuity except Kampo’s, residential mortgage loan by other bank

Post-privatization

Intermediary or broker of variable annuity except Kampo’s, residential mortgage loan by other bank

Kampo insurance Kampo insurance

Post-privatization

Sale of life insurance to corporate clientele, consigned by other life insurers

Post-privatization

Sale of life insurance to corporate clientele, consigned by other life insurers To hold the whole stake To sell the whole stake by Sep

MSI MSI MS Kirameki Life MS Kirameki Life MS MetLife MS MetLife

Fire insurance Personal accident (and

medical) insurance

Annuity non-life insurance Auto insurance, etc. Fire insurance Personal accident (and

medical) insurance

Annuity non-life insurance Auto insurance, etc. Death benefit product Whole life medical insurance Products to corporate

clientele

Death benefit product Whole life medical insurance Products to corporate

clientele

Variable annuity Fixed annuity Variable annuity Fixed annuity

Japan Post Japan Post Japan Post

Produce a joint strategy within the Group Produce a joint strategy within the Group to provide each financial institution with Group products meeting its need to provide each financial institution with Group products meeting its need

30 ,2017 30 ,2017 30 ,2017 30 ,2017

Deregulation schedule of bank OTC

Non-life insurance Life insurance

Loan-related long-term fire capital redemption (CLTD, etc.)

  • verseas traveller casualty

saving-type-annuity personal accident Personal annuity (fixed, variable) long term saving-type personal accident long term saving-type life Loan-unrelated personal fire single-premium whole life personal property, liability single-premium endowment saving-type fire installment endowment saving-type personcal accident (except disease) saving-type personal accident (except disease)

22-Dec-07

the rest of non-life policy lines the rest of life policy lines Group credit life

Apr-01 Oct-02 22-Dec-05

slide-12
SLIDE 12

11

11

Domestic Non-life : Claims Handling Innovation

Objectives Objectives Objectives

Improve quality of the claims payment service Offer fair, uniformed and speedy claims payment service Improve quality of the claims payment service Offer fair, uniformed and speedy claims payment service

Build pride in working on the front line of claims payment

services and increase job satisfaction thereof Morale Morale Morale raising reform Morale raising reform

Reconstruct a personnel system Enhance the system of education and training

Workforce, education Workforce, education Strengthen personnel system, enhance education and training Strengthen personnel system, enhance education and training

Build systems to prevent claims from payment mistake Rearrange units responsible to serve customers properly in

response Organization Organization Adjust organization and systems up to date Adjust organization and systems up to date

Reconstruct an accident report computer system Develop computer software to automatically determine

eligibility of claims

Update internal rules, important notices, etc.

Computer systems Computer systems Newly design business processes Newly design business processes

Replace products to those for customers easy to understand

and apply to claim benefit

Simplify job flows and terminal operations Compile policy clauses and interpretation guides

Products Products Refine products and policy clauses up to date Refine products and policy clauses up to date Internally check cases of claims handled Check cases of claims commissioned to lawyer, ones brought into litigation, and ones with

beneficiary missing

Make sure to send a notice to a claim applying policyholder upon payment Deal appropriately with cases resulted in no need to pay benefits for such reasons as

beneficiary’s declination to receive one.

Make a habit of re-checking in daily routine and the monthly meeting Maintain all information in good order, prevent operational risks from development Conduct “Good Job Movement” in the claims handling service

・Permeate and embed the Rules of Basic Actions ・Give training of customer service to employees in charge ・Continue to train the operations personnel to well communicate each other at workplace

Measures to improve quality in the claims handling service Measures to improve quality in the claims handling service

slide-13
SLIDE 13

12 (1) Increased accidents and delayed remedies for premium margin normalization (2) Payment per claim increased in bodily injury accidents (3) Effects of natural disasters

12

Issues in Domestic Non-life Earned-incurred loss ratio

Earned-incurred loss ratio of all lines Earned-incurred loss ratio of all lines

63.5% 70.4% 64.4% 67.6% 60% 62% 64% 66% 68% 70% 72% Fiscal 2004 Fiscal 2005 Fiscal 2006 Fiscal 2007

Factors of change in Earned-incurred loss ratio of the auto line for fiscal 2006 Factors of change in Earned-incurred loss ratio of the auto line for fiscal 2006

63.0% 63.5% 65.8% 66.2% 61% 62% 63% 64% 65% 66% 67% Fiscal 2004 Fiscal 2005 Fiscal 2006 Fiscal 2007

Earned-incurred loss ratio of the automobile insurance

(excl. adjustment expenses and provision for IBNR reserves)

Earned-incurred loss ratio of the automobile insurance

(excl. adjustment expenses and provision for IBNR reserves)

slide-14
SLIDE 14

13

13

Issues of Domestic Non-life

Premium Margin Normalization of Auto Policy Line

Take reasonable risks by appropriate underwriting practices Take reasonable risks by appropriate Take reasonable risks by appropriate underwriting practices underwriting practices More profit-conscious management at both regional divisions and braches More profit-conscious management at both More profit-conscious management at both regional divisions and braches regional divisions and braches

Underwriting standards of each office’s setting with details fitting its situation

Underwriting support computer system Underwriting support computer system

Increase non-fleet customers

Car Life Anshin and Anzen Plus Activities Car Life Anshin and Anzen Plus Activities

Factor analysis on and consultation to agents and fleet clients marking high loss ratio

Computer system for loss ratio Mgmt Computer system for loss ratio Mgmt

Campaign to prevent and decrease traffic accidents

I-stop Campaign I-stop Campaign

Revise premium rates and review coverage (to be implemented in fiscal 2008)

Product innovation Product innovation

Measures for improvement

Underwriting standards of each department or branch’s setting with details fitting its situation Take into consideration the attributes of local color and market of each office’s territory Develop a computer support system to apply the standards to underwriting without

exception

Increase non-fleet customers Conduct “Car Life Anshin (assurance) and Anzen (safety) Plus Activities” and other

measures taken by the Company as well as “retention of car owner household accounts” and “optimal proposal activity” at offices in linkage with Shikkari Kakuninn movement which advocates reminding an agent of checking the applicant with his/her policy features

Take reasonable risks by appropriate underwriting practices Take reasonable risks by appropriate underwriting practices

Make a factor analysis on agents and fleet clients marking high loss ratio and offer

consultation thereto

Factor analysis on poor performance, remedy planning, meeting and consultation Sequential control of remedy planning, meeting, consultation by the computer system

designed for this purpose

Conduct campaigns to prevent and decrease traffic accidents I-Stop Campaign of stop-watch-and-go “Kotsu Anzen-no Tobira (door to traffic safety)” was set up on our corporate website with

information and tools available to visitors.

More profit-conscious management at regional divisions and branches More profit-conscious management at regional divisions and branches

slide-15
SLIDE 15

14

14

Domestic Non-life : Expense Ratio

Net expense ratio Net expense ratio Company expense ratio Company expense ratio

36.4% 33.4% 32.2% 31.3% 30.8% 31.6% 30.8% 30% 31% 32% 33% 34% 35% 36% 37% 2001 2002 2003 2004 2005 2006 2007 (planned)

18.7% 16.4% 15.6% 14.9% 14.4% 14.7% 15.7% 14% 15% 16% 17% 18% 19% 2001 2002 2003 2004 2005 2006 2007

(planned) fiscal year fiscal year

Operation and system innovation Operation and system innovation Operation and system innovation

17.7% 17.0% 16.5% 16.4% 16.3% 16.1% 16.0% 15% 16% 17% 18% Fiscal 2001 2002 2003 2004 2005 2006 2007 plan Agent commission ratio Agent commission ratio

Product reform Sales activity reform Sales innovation Claims handling innovation Human resources reform Operational innovation Claims handling reform System architecture reform Sales channel reform, Agents’ activity reform

Claims handling innovation Claims handling innovation Claims handling innovation Sales innovation Sales innovation Sales innovation Product innovation Product innovation Product innovation Shain Hatsuratsu employee nurturing Business process innovation

Previous long-term vision

New Challenge 10 New Challenge New Challenge 10 10

An additional investment totaling Y18 bn is expected to be made in the innovations and for Shain Hatsuratsu under New Challenge 10. fiscal year

slide-16
SLIDE 16

15

1,898 1,194 1,830 1,732 1,388 1,123 1,469 200 400 600 800 1,000 1,200 1,400 1,600 1,800 2,000

2002 2003 2004 2005 2006 2007 plan 2008 forecast

15

Group Businesses : Mitsui Sumitomo Kirameki Life

MS Kirameki medium-term management plan (fiscal 2007-2010)

fiscal 2006 results fiscal 2007 plan fiscal 2008 forecast Y1,194.0 bn Y1,469.8 bn Y1,898.7 bn annually 66% annually 123% annually 129 % Y8,164.2 bn Y8,687.4 bn Y9,554.6 bn annually 103% annually 106% annually 110% New policies written In-force amount

Promote cross-sale of group members Promote cross-sale of group members’ ’ products products

In each area of the country, book cross-selling transactions

concentratedly to captive professional agents handling non-life products in the area

Explore new areas potential to growth as life market Explore new areas potential to growth as life market

Fiscal 2006 Fiscal 2010

1.5 times Fiscal 2006 results and fiscal 2007-08 outlook Fiscal 2006 results and fiscal 2007-08 outlook Fiscal 2006 results and fiscal 2007-08 outlook

Promote FC business (130 persons registered as of Apr 1,

2007)

Strategic approach to financials (banks, securities brokers,

Japan Post) for OTC sale

Increase sales support to large-scale life only agents

Fulfill Business Process Innovation Fulfill Business Process Innovation

Attentive to customers, always with business improvement

in mind

Upgrade systems to support business process

<< << 3 3 focused items for growth >> focused items for growth >>

# of policyholders, in-force amount, annual premiums on retention # of policyholders, in-force amount, annual premiums on retention

Cross-sale

New growth channels

Cross-sale

New growth channels

New policies New policies New policies New policies New policies New policies New policies New policies

9,555 8,687 8,164 7,940 5,037 6,855 5,779 2,500 5,000 7,500 10,000 12,500 2002 2003 2004 2005 2006 2007 plan 2008 forecast

In-force amount In-force amount

(Y bn) (fiscal year) Effective net income increased Y2.4 bn from a year before to Y6.9 bn for fiscal 2006. Life Playing Leaders, MSI’s employees dedicated solely to supporting Kirameki’s sales staff, were changed

to interlocking staff to reinforce tasks in corporate quality and legal compliance at Kirameki as well.

Continues to increase Loyal Members, who are agents recognized as sales beyond a certain level and also

able to sell life insurance on their own initiatives (1,706 agents recognized as of May 2007)

Numeric targets in MS Kirameki medium-term management plan Numeric targets in MS Kirameki medium-term management plan

“ “We pursue to gain deep trust from more customers by offering optimal protection in the high quality sales activity. We pursue to gain deep trust from more customers by offering optimal protection in the high quality sales activity. And thereby, we will sustain Kirameki And thereby, we will sustain Kirameki’ ’s s growth and contribute ourselves to further development of the Group. growth and contribute ourselves to further development of the Group.” ”

Kirameki mid-term management plan was formulated correspondently with MSI’s New Challenge 10. The plan aims to make contribution in raising Group Corp Profit. Kirameki mid-term management plan was formulated correspondently with MSI’s New Challenge 10. The plan aims to make contribution in raising Group Corp Profit. (Y bn) (fiscal year)

slide-17
SLIDE 17

16

16

Group Businesses : MS Kirameki Life Embedded Value Group Businesses : MS Kirameki Life Embedded Value

EV EV

54.8

Net asset value Net asset value

Mar 2006 Mar 2006 55.2 Mar 2007 Mar 2007 83.7

Amount in force Amount in force

104.1 138.6

Total Total

159.4 14%

Growth rate (excl capital injection) Growth rate (excl capital injection)

15%

(Y bn) Mar 2006 Mar 2007

Y20.0 bn Initial capital Initial capital 10.0 Apr-1998 injection Apr-1998 injection 25.0 Sep-2004 injection Sep-2004 injection Y159.4 bn EV as of Mar 2007 EV as of Mar 2007 Oct 1996

Breakdown of change for fiscal 2006 Breakdown of change for fiscal 2006

+8.3 Factor Factor Change amount Change amount +7.6

  • 1.6

+6.4 +20.8 New policies New policies Expected return on Mar-2006 EV Expected return on Mar-2006 EV Assumption-result variance, etc. Assumption-result variance, etc. Interest rate fluctuation and

  • ther investment-related effects

Interest rate fluctuation and

  • ther investment-related effects

Total Total

Increased Y20.8 bn (annually15%) Increased Y20.8 bn (annually15%) Increased Y20.8 bn Y138.6 bn Y138.6 Y138.6 bn bn Y159,4 bn Y159,4 Y159,4 bn bn

Y55.0 bn Total Total

(Y bn)

Change change +0.25% +5.9

  • 10%

+3.4 Interest rate

  • 0.25%
  • 6.8

Expenses +10%

  • 3.4
  • 10%

+9.0 800%? 600% +0.5 Accident frequency +10%

  • 8.9

Solvency margin ratio 800%? 1000%

  • 1.8
  • 10%

+3.9 7%? 6% +8.9 Cancellation rate +10%

  • 3.5

Discount rate 7%? 8%

  • 7.7

A 10% improvement means a drop,” for example from 5% to 4.5%, in respect of “accident frequency” and “cancellation

rate.

Mar 2006 Mar 2007 Accident frequency

Based on its recent 3-year historical data and the industry-wide statistics

Cancellation rate

Based on its recent 3-year historical data and the industry-wide statistics

Expenses Based on the expenses paid for the previous year Investment mgmt (Each yield applicable to new investment is the average one in the previous year.) New money is allocated according to the investment policy Yield applicable to new investment 10-year JGB ----------------1.46% 20-year JGB ----------------1.98% 30-year JGB ----------------2.34% New money is allocated according to the investment policy Yield applicable to new investment 10-year JGB---------------- 1.76% 20-year JGB---------------- 2.17% 30-year JGB---------------- 2.41% Solvency margin ratio Maintain 800% at lowest Discount rate 7% (as composition of risk-free interest rate plus risk premium) EV EV EV EV EV EV EV EV sensitivity sensitivity Assumptions for EV calculation Assumptions for EV calculation

(Y bn)

slide-18
SLIDE 18

17

17

Group Businesses : Mitsui Sumitomo MetLife

Rapid growth sustained fiscal 2006 Rapid growth sustained fiscal 2006 Rapid growth sustained fiscal 2006

Y2, 311.9 bn (annually +45%) Y4.4 bn (annually +19%)

Further growth in fiscal 2007-2008 Further growth in fiscal 2007-2008 Further growth in fiscal 2007-2008

Y693.3 bn (annually +25%) Y825.0 bn Y1,000 bn Y3,022.5 bn Y3,919.6 bn Y5.0 bn Y6.6 bn

Fiscal 2010 targets in the mid-term plan Fiscal 2010 targets in the mid-term plan Fiscal 2010 targets in the mid-term plan

Net income of Y20 bn (by US GAAP) (equity in earnings of Y10 bn) Turn to single-year profit (by Japanese GAAP)

  • 6.3 bn
  • 5.6 bn

109 agents(annually +62agents)

39.2 477 886 1,591 2,312 47 19 109 30 23 500 1,000 1,500 2,000 2,500 3,000 2002 2003 2004 2005 2006 20 40 60 80 100 120 amount in force # of agents

(Y bn) (agents)

Premium income Premium income Amount in force Amount in force

Equity in earnings by USGAAP (forecast) Equity in earnings by USGAAP (forecast)

# of agents # of agents Premium income Premium income Amount in force Amount in force

Equity in earnings by US GAAP Equity in earnings by US GAAP

Fiscal 2007 plan Fiscal 2007 plan Fiscal 2008 plan Fiscal 2008 plan

Equity in earnings by Japanese GAAP Equity in earnings by Japanese GAAP

Create new business opportunities by opening new distribution channels Proactively move to Japan Post’s privatization, study feasibility of distribution via MSI’s agents Strengthen product competitiveness Develop innovative new-generation products, revise product to meet market need better Strengthen the existing OTC channels Increase share within an existing bank agent, keep seeking for new OTC banks Maintain and develop salespersons’ education program on an industry-top level Focus sales promotion on annuity products with reinforcing salespersons’ training Ensure that a salesperson should adequately explain the subject and function of a policy upon

  • ffering

Increase MS MetLife’s publicity by a strategic PR campaign

Key measures to the targets Key measures to the targets

Develop sales base Develop sales base Develop sales base

Increase customer satisfaction Enhance the call center system, upgrade system infrastructure, gather customers’ comments by

survey

Sincerely respond to complaints, etc. for early solution Strengthen the customer protection system, etc. Get the claim handling system well prepared for appropriate payments, prepare sales materials

accurate and easy to understand, strengthen compliance awareness

First priority to customers First priority to customers First priority to customers

slide-19
SLIDE 19

18

18

  • 64

1,127 1,063 20%

Group Businesses : MS MetLife Embedded Value Group Businesses : MS MetLife Embedded Value

EV EV

  • 28

Net asset value Net asset value Mar 2006 Mar 2006 Mar 2007 Mar 2007 912 Amount in force Amount in force 884 Total Total 48% Growth rate (except capital injection) Growth rate (except capital injection) (Y bn) Mar 2006 Mar 2007 Y3.0 bn Initial capital Initial capital Y3.1 bn Fiscal 2002 injection Fiscal 2002 injection Y22.4 bn Y11.7 bn Y40.2 bn Fiscal 2003 injection Fiscal 2003 injection Fiscal 2004 injection Fiscal 2004 injection Total Total Y106.3 bn EV as of Mar 2007 EV as of Mar 2007 Jul 2002 +117 Factor Factor Change amount Change amount +73

  • 11

+179 New policies New policies Expected return on Mar-2006 EV Expected return on Mar-2006 EV Assumption-result variance, etc. Assumption-result variance, etc. Total Total Breakdown of change for fiscal 2006 Breakdown of change for fiscal 2006 Increased Y17.9 bn (annually 20%) Increased Y17.9 bn (annually 20%) (Y bn) Y88.4 bn Y88.4 Y88.4 bn bn Y106.3 bn Y10 Y106 6. .3 3 bn bn

MS MetLife MS MetLife’ ’s embedded value (EV) s embedded value (EV)

EV sensitivity EV sensitivity

  • EV increased to Y106.3 bn, or more than 2.5 times of total investment, after 4.5 years since the establishment
  • A Y11.7 bin EV was generated from the fiscal 2006 new policies of Y693.3 bn

Assumption for EV calculation Assumption for EV calculation

  • 68

7%→8% +74 7%→6% Discount rate

  • 7

+ 10% Mortality rate

  • 10

+ 10% Cancellation rate

  • 19
  • 0.5%

Return on segregated assets 7% as composed of risk-free interest rate plus risk premium Discount rate Maintain 600% or higher Solvency margin ratio Set a return rate for each sub-portfolio by policy line (5% on equities, 2% on bonds, 3% on foreign bonds and 0% on short-term funds) Return on segregated assets Based on the historical and planned expenses and a coefficient in proportion to number of policies in force Expenses

Based on its historical data and the industry-wide results

Mortality rate

Based on its historical data and the industry-wide results

Cancellation rate (Y bn)

slide-20
SLIDE 20

19

Sub-segment Investment

Net income fiscal 2006

ROI (%) Sub-segment Investment

Net income fiscal 2006

ROI (%) Asean 57.4 5.3 9.2 Americas 42.1

  • 1.8
  • 4.2

East Asia 61.4 2.5 4.0 Re-insurance 45.5 5.0 11.1 Europe 19.8 2.0 10.3 Total 238.3 13.7 5.8

19

Overseas Business (1) : Overseas Earnings

*Overseas total includes those booked to the head office, consolidation adjustments pertaining to mergers and acquisitions, and others for the period, which are unattributable to any particular sub-segment. 238.4 212.9 35.2 90.9 19.6 67.1 27.5 72.3 35.2 103.2 37.7 267.9 32.0 85.1 112.8

0.0 100.0 200.0 300.0

Net premiums written Net premiums written

(Y bn)

Asia Asia Asia Americas Americas Americas Europe Europe Europe Reinsurance Reinsurance Reinsurance Overseas total Overseas total Overseas total

2006 2008 forecast 2007 plan

11.7 15.6 9.4

  • 1.8

8.1 5.0 2.4 5.6 4.5 1.9 8.0 17.0 6.0 5.0 2.5

  • 5.0

0.0 5.0 10.0 15.0 20.0

Net income Net income

2006 2008 forecast 2007 plan 2006 2008 forecast 2007 plan 2006 2008 forecast 2007 plan 2006 2008 forecast 2007 plan

Asia Asia Asia Americas Americas Americas Europe Europe Europe Re-insurance Re-insurance Re-insurance Overseas total Overseas total Overseas total

2006 2008 forecast 2007 plan 2006 2008 forecast 2007 plan 2006 2008 forecast 2007 plan 2006 2008 forecast 2007 plan 2006 2008 forecast 2007 plan (Y bn)

The Asian operation increased earnings remarkably together with contributions from the businesses

acquired in the past. The fiscal 2007 plan foresees net income slowdown due to premium rates easing in some local markets.

After stagnation period of Brazilian operation, the Americas operation expects to increase net profit

considerably for fiscal 2007, by strictly selective underwriting in the US and earnings recovery in Brazil.

The European sub-segment is expected to grow consistently in fiscal 2007, keeping the Lloyd’s business

and business with Japanese companies there going well.

The re-insurers made a V-shaped recovery fiscal 2006 because of large-scale natural disasters

decreased significantly, and expect net income for fiscal 2007 will exceed fiscal 2006, together with capacity increased by the capital injection.

The Asian operation increased earnings remarkably together with contributions from the businesses

acquired in the past. The fiscal 2007 plan foresees net income slowdown due to premium rates easing in some local markets.

After stagnation period of Brazilian operation, the Americas operation expects to increase net profit

considerably for fiscal 2007, by strictly selective underwriting in the US and earnings recovery in Brazil.

The European sub-segment is expected to grow consistently in fiscal 2007, keeping the Lloyd’s business

and business with Japanese companies there going well.

The re-insurers made a V-shaped recovery fiscal 2006 because of large-scale natural disasters

decreased significantly, and expect net income for fiscal 2007 will exceed fiscal 2006, together with capacity increased by the capital injection. (Y bn, %)

Overseas investment and return Overseas investment and return

* “Total” includes those from South Korea, Oceania, Middle East and India and states figures before amortization of consolidation adjustment.

slide-21
SLIDE 21

20 Asia

20

Overseas Business (2) : Business Expansion

Take corporate risks, mainly in the Lloyd’s

business

North America: Increase underwriting good

risks, mainly Japanese companies, and raise profitability

Central and South America: Raise profitability

  • f the existing insurance subsidiaries

Increase underwriting good risks

Europe Europe Europe Americas Americas Americas Re-insurance Re-insurance Re-insurance

In each local market, increase presence of being a top-class

insurer of best corporate quality and pursue further expansion to establish an outstanding business base

China: Upgrade Shanghai branch to a subsidiary, build its own

network and extend the service network through the alliance with China insurance

India: Foster the subsidiaries and utilize the risk management

subsidiary

Asia Asia Asia

  • Establish the tri-regional framework of Asia, Europe and Americas,

Establish the tri-regional framework of Asia, Europe and Americas, and strengthen HQ and strengthen HQ’ ’s supervision on governance - s supervision on governance -

  • Select and focus on strategic areas and businesses to invest in -
  • Select and focus on strategic areas and businesses to invest in -

Business development by sub-segment Business development by sub-segment

14 subsidiaries and affiliates in 8 nations/territories are engaged in insurance business under the control of

Singapore-based MSIG Holdings (Asia) Pte. Ltd.

Expand business: making use of the current bancasurance network in the personal market, and focusing on

Japanese companies and medium/small-sized local enterprises in the corporate market.

Extend technology assistance for sound development of the insurance industry in each nation within the

region.

Continuously seek for an investment opportunity in the region as an important strategic region.

ASEAN + HK

Strengthen product development in sight of the scheduled deregulation of insurance business, increase sales

power with more Mingtai’s captive agents and bancassurance banks.

Upgrade the administration, improve quality and strengthen management base, and thereby contribute to

development of the insurance industry in Taiwan

Taiwan

A highly potential market of life and non-life insurance with a 1.1 billion population Cholamandalam MS General, a non-life joint venture with the Murugappa Group, increased gross premiums

written by 45% for fiscal 2006 with net profit for the first time. Branches increased in number to 64 in India.

Will strengthen product development and promote risk service business to increase not only personal

insurance but corporate business with Japanese and Koreans as well as medium/small-sized local enterprises.

India

MSI’s Lloyd’s syndicate has grown 16th largest out of 66 in terms of premium volume. Keep the European

  • peration growing, mainly targeting corporate clientele.

Established an agent solely for Lloyd’s management Jan 2007, and will enhance MSI’s presence in London

insurance market as one of Lloyd’s primary members.

Lloyd’s

Chinese economy has been sustaining growth of some 8% per year. Direct investment from Japan has been

increasing in terms of both contract number and paid-in amount. Benefiting from such trends, MSI’s Shanghai branch has been growing business smoothly.

Strengthen product development and reinsurance business through alliance with the China Pacific Insurance. Will expand business by upgrading Shanghai branch to a subsidiary (application filed), and reinforcing the

alliance with China Pacific Insurance to a comprehensive basis, with entry into the life insurance business in scope.

China

Mitsui Sumitomo Reinsurance, specialized in underwriting Asian and European specific risks on a treaty basis,

continues to select profitable and good risks ceded by medium/small-sized local insurers by sounding them out with a proposal in locally based operation.

MS Frontier Reinsurance, specialized in catastrophic natural disaster risks, will pursue to stabilize and secure

earnings, using capital injected last year for further business expansion and risk diversification.

Re-insurance Europe

slide-22
SLIDE 22

21

21

  • 1.8

2.4 8.1 5.0

  • 2.0
  • 5

5 10 15 20 25

New business investment, etc New business investment, etc

Overseas Business (3) : Road to Fiscal 2010 Overseas GCP

Fiscal 2006 Fiscal 2010

Y11.7 bn Y20 bn

(Y bn) Asia Asia Asia Americas Americas Americas Europe Europe Europe Re-insurance Re-insurance Re-insurance

Amortization of consolidation adj Amortization of Amortization of consolidation consolidation adj adj

The overseas business is expected to achieve the GCP target of Y20bn for fiscal 2010 on growth of

the existing business portfolio with some additional investments.

Earnings from new businesses would be additional to the planned profit. Cyclical move in the insurance market, growth rate of each national economy, interest rates, forex

rates, etc. are factors that may affect final results of the GCP target.

Business growth outlook in Asia Business growth outlook in Asia

Gross premiums written by policy line (outlook) Gross premiums written by policy line (outlook) Gross premiums written by policy line (outlook) Gross premiums written by country/territory (outlook) Gross premiums written by country/territory (outlook) Gross premiums written by country/territory (outlook)

Fiscal 2006 Fiscal 2010

China India Taiwan Vietnam Hong Kong Thailand

  • S. Korea

Malaysia Singapore Indonesia Philippines

Fiscal 2006 Fiscal 2010

Automobile Fire Cargo Miscellaneous Personal accident

Y 140 bn Y190 bn

slide-23
SLIDE 23

22

22 31.2 40.8 47.8 36.3 21.0 27.8 26.8 29.4 28.9 0.0 20.0 40.0 60.0 80.0 100.0 120.0 140.0 160.0 180.0 Fiscal 2004 Fiscal 2004 Fiscal 2004 Fiscal 2004 Fiscal 2005 Fiscal 2005 Fiscal 2005 Fiscal 2005 Fiscal 2006 Fiscal 2006 Fiscal 2006 Fiscal 2006 0.0 0.5 1.0 1.5 2.0 2.5 3.0 Income yield (balance by left scale)

1,000 2,000 3,000 4,000 5,000 6,000 7,000 8,000 Mar 2005 Mar 2006 Mar 2007 Deposits, etc. Bonds Stocks Foreign secs Other secs Loans Real Estate

Investment Management : Investment Performance

Dividend increase due to recovery of corporate earnings, bullish foreign stock markets, and weaker yen Increased interests + dividends received

Remark on the fiscal 2006 return Remark on the fiscal 2006 return Investment portfolio Investment portfolio

Rise in stock prices, etc. Increased portfolio balance

Remark on the fiscal 2006 balance Remark on the fiscal 2006 balance

24% 41% 16% 10%

(Y bn)

Interests + dividends received Interests + dividends received

(%) (Y bn)

(Y bn)

Breakdown of portfolio Breakdown of portfolio Breakdown of interests + dividends Breakdown of interests + dividends

March 2005 March 2006 March 2007 Weight Deposits, etc. 376 372 347 4.7% Bonds 1,709 1,744 1,780 24.1% Stocks 2,008 2,851 3,010 40.7% Foreign securities 1,021 1,133 1,194 16.1% Other securities 101 124 113 1.5% (Alternative investment

  • incl. in securities)

(77) (106) (142) (1.9%) Loans 771 756 746 10.1% (Personal loans incl. in loans) (327) (347) (367) (5.0%) Real Estate 225 218 210 2.8% < Total > 6,214 7,200 7,401 100.0% Fiscal 2004 Fiscal 2005 Fiscal 2006

(Annual change)

Deposits, etc. 2.0 4.4 6.2 1.7 Bonds 29.4 26.8 28.9 2.1 Stocks 21.0 27.8 36.3 8.4 Foreign securities 31.2 40.8 47.8 70.0 Other securities 5.7 16.8 11.1

  • 5.6

Loans 13.7 12.8 13.4 0.6 Reak Estate 7.1 7.1 7.1 0.0 < Total > 110.4 136.9 151.2 14.3

< Reference > Investment portfolio to total assets

March 2005 March 2006 March 2007 Weight Total assets 6,580 7,537 7,744 100.0% Portfolio 6,214 7,200 7,401 95.6% Others 366 337 342 4.4%

(Y bn)

Fiscal 2006 Deposits, etc. 2.01% Bonds 1.63% Stocks 3.97% Foreign securities 4.38% Other securities 10.59% Loans 1.77% Real Estate 3.28% < Total > 2.92%

Income yield by asset Income yield by asset

(Y bn)

slide-24
SLIDE 24

23

By the end of fiscal 2010, MSI aims to complete a portfolio (referred to as the “basic portfolio”) whose model

is based on expected return, risk and correlation among the assets, and designed to maximize “risk-adjusted return” (i.e. return on investment after deducting all funding cost, capital cost and expenses).

In the course of tuning up to the basic portfolio, the “annual portfolio” is established based on the year’s

assumptions such as annual cash flow and market outlook, with intention to adjust the asset allocation more precisely to the basic portfolio.

23

Control risks properly,

with special attention to the attributes on the liability side in the asset liability management

Stabilize return and

keep assets sound

Investment Management (2) : Investment Mgmt Strategy

Increase fair value of net asset by optimizing risk-return correlation and with all costs taken into calculation

Risk control Risk control Basic policy of investment Basic policy of investment

Aims to build a medium-term portfolio (“basic portfolio”) with

assets allocated based on passive management, considering the attributes of both assets and liabilities

Aims to build a medium-term portfolio (“basic portfolio”) with

assets allocated based on passive management, considering the attributes of both assets and liabilities

Aims at higher return than passive management Aims at higher return than passive management

Basic portfolio management Basic portfolio management Active investment Active investment Environment change

Domestic non-life insurance Higher stock prices Increase in market value of stocks held; an estimated Y160 bn increase per 1,000-yen rise in the Nikkei 225 Higher interest rate Increase in net asset value of general and segregated accounts, increase in interests and dividends received Stronger yen Decrease in yen-translated values of foreign-currency- denominated assets and reserves

What’s the basic portfolio mgmt? What What’ ’s the basic portfolio mgmt? s the basic portfolio mgmt? Effect of macro-economic changes Effect of macro-economic changes

slide-25
SLIDE 25

24

24

Investment Management (3) : Investment Mgmt Strategy

Increase investment in hedge funds By way of MSI Venture Capital Invest in university ventures Establish buyout investment funds

Considering the risk-return attributes of balance sheets

Lengthen the duration of assets Utilize interest rate swap Continuously promote personal loans Broaden the investment scope to project

finance and other unconventional types of finance

Increase of credit investment Increase of credit investment Increase of credit investment Alternative investment Alternative investment Alternative investment ALM ALM ALM Incorporate the following in an annual portfolio description

Ease interest rate risks by lengthening the duration

  • f yen-denominated assets, and utilizing swap

transactions

Reduce asset-fluctuation risks on Japanese stocks

by selling part of them

Increase credit investment including personal

loans

Increase alternative investment

Fiscal 2007 management policy Fiscal 2007 management policy Fiscal 2007 management policy

Consistent increase in personal loans Consistent increase in personal loans

Personal loan balance Personal loan balance Personal loan balance March 2005 March 2006 March 2007 March 2008 (plan) 327 347 367 394

(Y bn)

Alternative investment balance Alternative investment balance Alternative investment balance

(Y bn) March 2005 March 2006 March 2007 March 2008 (plan) 77 106 142 167

Lengthening the average duration of bonds Lengthening the average duration of bonds

Maturity ladder of bonds Maturity ladder of bonds Maturity ladder of bonds

(weight) (weight) (weight) (weight) (weight) (weight) March 2005 245 14.3% 308 18.0% 402 23.5% 314 18.4% 332 19.4% 109 6.4% March 2006 160 9.2% 296 17.0% 395 22.7% 283 16.2% 333 19.1% 278 15.9% March 2007 86 4.9% 302 17.0% 408 22.9% 353 19.9% 207 11.6% 423 23.8%

7-10 years

  • ver 10 years

(incl. unspecific)

Less than 1 year 1-3 years 3-5 years 5-7 years (Y bn)

Increase of alternative investment Increase of alternative investment

slide-26
SLIDE 26

25

25

Major Financial Indicators

(million yen)

▼Fundamentals

Fiscal 2002 Fiscal 2003 Fiscal 2004 Fiscal 2005 Fiscal 2006 Common stock 128,476 139,595 139,595 139,595 139,595 Total shares issued (as of March 31)

(thousand)

1,451,592 1,454,923 1,431,265 1,420,621 1,411,202 Net assets 1,026,508 1,400,074 1,452,642 2,006,423 2,127,884 Total assets 5,900,738 6,457,173 6,580,694 7,537,443 7,744,782 Net income 32,362 72,955 60,765 64,842 55,352 Return on shareholders' equity [ROE] (cosolidated)

(%)

2.8 6.4 4.6 4.1 2.9 < Reference > ROE by the US GAAP

(%)

2.3 7.1 2.1 5.3

  • Equity ratio

(%)

17.4 21.7 22.1 26.6 27.5

▼Per-share data

Earnings per share [EPS]

(%)

22.15 50.59 42.08 45.49 38.98 Net assets per share

(yen)

707.1 962.3 1,014.9 1,412.4 1,507.9 Dividend per share (annual)

(yen)

7.5 8.5 9.5 13.0 14.0

▼Stock price and its related data

Stock price (closing, March 31)

(yen)

508 1,108 983 1,601 1,479 Price earnings ratio [PER] 22.93 21.90 23.36 35.19 37.94 Price book-value ratio [PBR] 0.72 1.15 0.97 1.13 0.98 < Reference > [Adjusted PBR] 0.57 0.95 0.82 0.99 0.85 Payout ratio

(%)

33.9 16.8 22.6 28.6 35.9 < Reference > Group Core Profit-based payout ratio

(%)

  • 47.4

25.0 30.6(estimated)

*all figures stated on a non-consolidated basis unless otherwise noted Adjusted PBR calculation: adjusted PBR = market capitalization / {net assets + (catastrophe loss reserves + reserves for price fluctuation) x (1- tax rate of 36%)}

slide-27
SLIDE 27

26

26 8.5 9.5 14 13 7.5 2 4 6 8 10 12 14 16 Fiscal 2002 Fiscal 2003 Fiscal 2004 Fiscal 2005 Fiscal 2006 Year-end Interim (yen)

73.9 64.0 28.6 10 20 30 40 50 60 70 80 Fiscal 2003 Fiscal 2004 Fiscal 2005

Dividends Buyback Group Core Profit (Y bn)

Capitalization Policy (1) Distribution to Shareholders

Distribution to shareholders Distribution to shareholders Dividend per share Dividend per share

Appropriate about 40% of GCP to distribution to shareholders via dividends and buyback of our own shares Appropriate about 40% of GCP to distribution to shareholders Appropriate about 40% of GCP to distribution to shareholders via dividends and buyback of our own shares via dividends and buyback of our own shares Keep it on a rising trend Dividend per share Dividend per share

Move flexibly, watching supply-demand balance and trend of the stock market

Buyback of shares Buyback of shares

* Dividends and buyback are stated in a year relevant to their source of fund. Year-end dividend is planned 8 yen per share for fiscal 2006.

  • Distribute to shareholders, through dividend payment and buyback of our own shares, an estimated amount equivalent to 40 %
  • f annual Group Core Profit (GCP)
  • Basically maintain dividend per share on a rising trend
  • Distribute to shareholders, through dividend payment and buyback of our own shares, an estimated amount equivalent to 40 %
  • f annual Group Core Profit (GCP)
  • Basically maintain dividend per share on a rising trend

Buyback track record Buyback track record GCP and distribution to shareholders GCP and distribution to shareholders

Period # of shares (1,000) Amount paid (Y mn)

Mar-Dec 2002 25,895 14,570 Oct-Dec 2003 29,381 25,999 Aug-Oct 2004 23,073 21,485 Sep 2005 10,000 11,992 Feb-Mar 2007 7,846 11,499 Total 96,195 85,545

(Y bn, %) Fiscal 2003 Fiscal 2004 Fiscal 2005

Group Core Profit (GCP) 64.0 28.6 73.9 Dividends 12.4 13.6 18.5 Share buyback 21.5 12.0 11.5 Dividends + buyback (= distribution) 33.9 25.6 30.0 Distribution / GCP 53% 90% 41%

slide-28
SLIDE 28

27

27

Capitalization Policy (2) Reduction of stocks held, use of capital

net asset value net asset value ( ( ( ( ( ( ( (NAV NAV) ) ) ) ) ) ) ) Total risk exposure Total risk exposure

[99%VaR] [99%VaR]

Buffer capital for Buffer capital for business continuity business continuity

Fluctuates Fluctuates

Fiscal 2004 Fiscal 2005 Fiscal 2006 Stocks sold 86.9 58.8 32.3 Capital gains 48.0 40.1 23.9

Sell-out track record of stocks Sell-out track record of stocks Net excess capital vulnerable to market fluctuations (because of unrealized capital gains on stocks held accounting for about 60% of NAV) Net excess capital vulnerable to market fluctuations (because of unrealized capital gains on stocks held accounting for about 60% of NAV) Sell out part of the stocks held Reallocate assets in the portfolio Sell out part of the stocks held Reallocate assets in the portfolio

Higher capital efficiency Higher capital Higher capital efficiency efficiency Stabilized capital base Stabilized Stabilized capital base capital base

Underpinned by it, make investments in areas with high growth potentiality Underpinned by it, make investments in areas with high growth potentiality

Net excess capital Net excess capital

(Y bn)

Net excess capital will be utilized to invest in areas with high growth potentiality. On the other hand, unrealized capital gains on stocks held account for about 60% of the fair

value of net assets.

While unrealized capital gains provide solvency in the insurance business, they may cause

NAV to shrink on a bearish market.

We are going to keep steady steps in selling the stocks held to reduce the risk-fluctuating

factor, and thereby stably retain capital adequacy.

slide-29
SLIDE 29

28

Takashi Nishimura, CPCU, ARM

Assistant General Manager, Investor Relations Department Mitsui Sumitomo Insurance Company Limited Phone: 81-3-3297-6742 Facsimile: 81-3-3297-6888 e-mail :tk-nishimura@ms-ins.com http://www.ms-ins.com

28 Fiscal 2006 forecast Fiscal 2006 resutls Fiscal 2007 plan 1,310.0 1,324.4 1,315.0 64.5% 63.1% 65.5% 31.6% 30.8% 31.6% 96.1% 93.9% 97.1% 85.2 93.9 85.9 55.0 55.3 56.0 1,476.0 1,492.2 1,533.0 61.7 64.9 68.1 3.0% 3.1% 3.0% 40.9 40.1 43.7 Overseas business 10.2 11.7 15.6 9.0 11.4 8.5 1.6 1.7 2.1 0.0 0.0

  • 1.8

61.7 64.9 68.1 Group Core Profit (GCP) Net premiums written (*1) Net loss ratio Net expense ratio Combained ratio Total Risk-related ROE(GCP-based) Domestic non-life Life insurance (*2) Financial services Interests and dividends received Net income Consolidated net premiums written

MSIG Financial Highlights

Non-consolidated Non-consolidated Consolidated Consolidated GCP by business GCP by business

*1. “Net premiums written” exclude those of Modorich but include the effect caused by the abolished governmental reinsurance of the compulsory automobile liability insurance (“CALI”). *2. The figure in respect of “Life insurance” represents a sum of MS Kirameki’s net income before the provision of additional policy reserve for standard underwriting reserve and MS MetLife’s equity in earnings by the US GAAP.

Appendix Appendix Appendix Appendix Appendix Appendix Appendix Appendix (Y bn)

Inquiries Inquiries