Neuroscience 2004 A. Single Areas B. Multiple Areas Functional - - PDF document

neuroscience 2004
SMART_READER_LITE
LIVE PREVIEW

Neuroscience 2004 A. Single Areas B. Multiple Areas Functional - - PDF document

A Brief Outline I. Hypothesis of functional specificity Neuroscience 2004 A. Single Areas B. Multiple Areas Functional Brain Imaging II. Brain Mapping Techniques A. Lesion- Based Methods 1. Positron Emission Tomography, PET 2. Functional


slide-1
SLIDE 1

Page 1

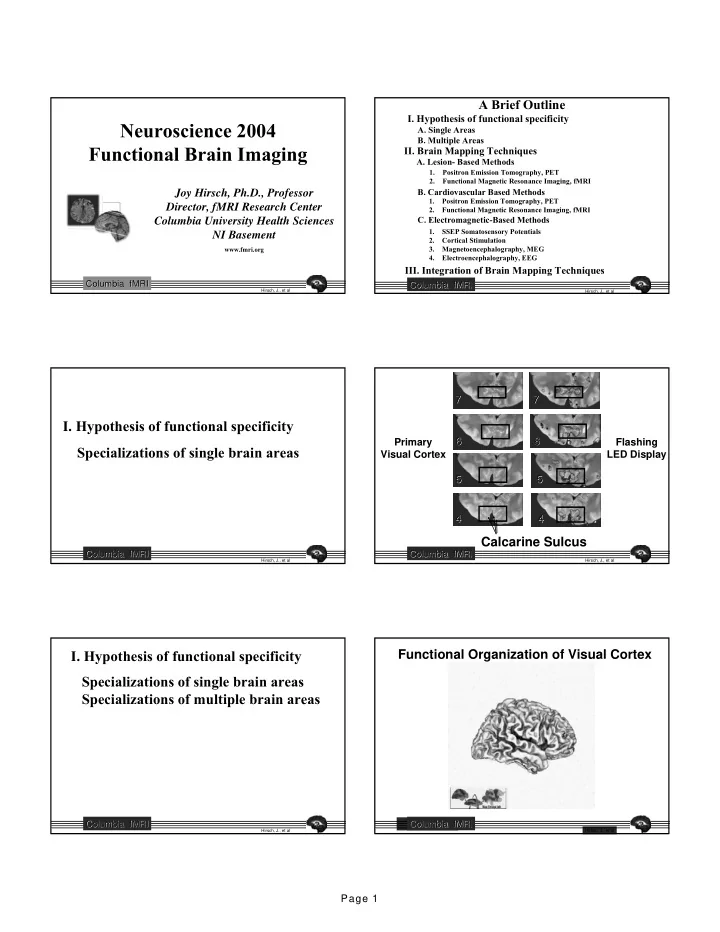
Joy Hirsch, Ph.D., Professor Director, fMRI Research Center Columbia University Health Sciences NI Basement

www.fmri.org

Neuroscience 2004 Functional Brain Imaging

Hirsch, J., et al

Columbia fMRI Columbia fMRI

  • I. Hypothesis of functional specificity

Hirsch, J., et al

Columbia fMRI Columbia fMRI

  • II. Brain Mapping Techniques

1. Positron Emission Tomography, PET 2. Functional Magnetic Resonance Imaging, fMRI

A Brief Outline

  • A. Lesion- Based Methods
  • B. Cardiovascular Based Methods
  • III. Integration of Brain Mapping Techniques
  • A. Single Areas
  • B. Multiple Areas

1. Positron Emission Tomography, PET 2. Functional Magnetic Resonance Imaging, fMRI

  • C. Electromagnetic-Based Methods

1. SSEP Somatosensory Potentials 2. Cortical Stimulation 3. Magnetoencephalography, MEG 4. Electroencephalography, EEG

  • I. Hypothesis of functional specificity

Hirsch, J., et al

Columbia fMRI Columbia fMRI

Specializations of single brain areas

Hirsch, J., et al

Columbia fMRI Columbia fMRI

Primary Primary Visual Cortex Visual Cortex Flashing Flashing LED Display LED Display 7 7 7 7 6 6 6 6 5 5 4 4 4 4 5 5

Calcarine Sulcus

  • I. Hypothesis of functional specificity

Hirsch, J., et al

Columbia fMRI Columbia fMRI

Specializations of single brain areas Specializations of multiple brain areas

Functional Organization of Visual Cortex Functional Organization of Visual Cortex

Hirsch, J., et al

Columbia fMRI Columbia fMRI

slide-2
SLIDE 2

Page 2

Hirsch, J., et al

Columbia fMRI Columbia fMRI

  • II. Brain Mapping Techniques
  • A. Lesion-Based Methods

Previous Previous Surgical Surgical lesion lesion

BINOCULAR BINOCULAR FLASHING FLASHING LIGHTS LIGHTS Left Eye Left Eye Right Eye Right Eye

Visual Field Visual Field

Harrington, 1964

lesion R R

Hirsch, J., et al

Columbia fMRI Columbia fMRI

HISTORICAL MILESTONES

Neuroscience and Medicine Physics and Engineering

BROCA Aphasia and lesions in GFi FARADAY Magnetic properties of blood HARLOW Phineas Gage ROY & SHERRINGTON Relationship between neural activity and vascular changes BRODMANN Cytoarchitectonic regions

  • f cortex

PENFIELD Intraoperative cortical maps PAULING Change of magnetic state of hemoglobin with oxygenation RABI Discovery of Magnetic Resonance PURCELL / BLOCK Demonstration of NMR in condensed matter MOSSO Blood flow and cognitive events HAHN Discoverer of spin echo phenomenon 1841 1845 1874 1881 1890 1909 1936 1945 1949 1950 Columbia fMRI Columbia fMRI

Hirsch, J., et al

FUNCTIONAL SPECIFICITY AND NEUROIMAGING

WERNICKE Aphasia and lesions in GTs 1861

Damasio, H., et al; Science 264: 1102-1105, 20 May 1994

Hirsch, J., et al

Columbia fMRI Columbia fMRI

Phineas Gage Phineas Gage

  • II. Brain Mapping Techniques

Hirsch, J., et al

Columbia fMRI Columbia fMRI

  • 1. Positron Emission Tomography, PET
  • B. Cardiovascular Based Methods

DAMADIAN Discovery that biological tissues have different relaxation rates HOUNSFIELD CORMACK Invention of Computed Tomography MANSFIELD First MRI of a body part invention of EPI (scans whole brain in secs.) LAUTERBUR First MR image OGAWA

Blood Oxygen dependent signal EPI/MRI and neural events

BELLIVEAU

Cortical map of the human visual system: fMRI

PETERSON/FOX POSNER/RAICHLE

PET study of human language Radiolabeled blood flow and neural events

1971 1972 1977 1976 1990 1984 1992 TER-POGOSSOAN SOKOLOFF

First PET studies of brain metabolism, blood flow, and correlates of human behavior

Neuroscience and Medicine Physics and Engineering

1981 HILAL First clinical MRI scanner

Hirsch, J., et al

Columbia fMRI Columbia fMRI

HISTORICAL MILESTONES FUNCTIONAL SPECIFICITY AND NEUROIMAGING

slide-3
SLIDE 3

Page 3

Positron Emission Tomography

Radionuclides that emit positrons such as 15O and 18F are introduced into the brain. H2

15O behaves like H2 16O and

indicates blood flow (rCBF) (half life = 123 seconds) integration time ≈ 60 seconds.

18F – deoxyglucose behaves like

deoxyglucose and indicates metabolic activity (half-life = 110 minutes) integration time ≈ 20 minutes

From: www.epub.org.br/cm/n011pet/pet.htm

PET SCANNER

Hirsch, J., et al

Columbia fMRI Columbia fMRI

  • a. Source of Signal
  • a. Source of Signal

Principle of PET

From: Principles of Neural Science (4th. Ed.) Kandel, Schwartz, & Jessell, p. 377.

A2 Positron and electron annihilation and emission of gamma rays PET is based on the radioactive decay of positrons from the nucleus

  • f the unstable atoms (15O has 8

protons and 7 neutrons)

resolution limit

Electron Positron Unstable radionuclide 0-9mm Gamma ray Site of positron annihilation (imaged point) Gamma ray photon A1 Positron emission in the brain

Hirsch, J., et al

Columbia fMRI Columbia fMRI

  • II. Brain Mapping Techniques

Hirsch, J., et al

Columbia fMRI Columbia fMRI

  • a. Source of signal
  • b. Measurement techniques
  • 1. Positron Emission Tomography, PET
  • B. Cardiovascular Based Methods

Gamma Ray Detections to Location of Function

From: Principles of Neural Science (4th. Ed.) Kandel,Schwartz, & Jessell, p. 377.

Hirsch, J., et al

Columbia fMRI Columbia fMRI

Injection of radioactive-labeled water for PET scanning

Hirsch, J., et al

Columbia fMRI Columbia fMRI

  • II. Brain Mapping Techniques

Hirsch, J., et al

Columbia fMRI Columbia fMRI

  • a. Source of signal
  • b. Measurement techniques
  • c. Computation for analysis
  • 1. Positron Emission Tomography, PET
  • B. Cardiovascular Based Methods
slide-4
SLIDE 4

Page 4

From: Images of Mind by Posner, M. and Raichle, M. Scientific American Library, 1994, p. 24

Fixation Flashing Checkerboard

Stimulation Fixation Difference Individual difference images Mean difference image

Analysis of PET Results

Hirsch, J., et al

Columbia fMRI Columbia fMRI

  • II. Brain Mapping Techniques

Hirsch, J., et al

Columbia fMRI Columbia fMRI

  • 2. Functional Magnetic Resonance Imaging, fMRI
  • 1. Positron Emission Tomography, PET
  • B. Cardiovascular Based Methods

HISTORICAL MILESTONES

1977 TER-POGOSSIAN SOKOLOFF

First PET studies of brain metabolism, blood flow, and correlates of human behavior

MANSFIELD 1976

First MRI of a body part Invented EPI (scans whole brain in secs.)

1972 LAUTERBUR

First MR image

OGAWA

Blood Oxygen dependent signal EPI / MRI Behavior

BELLIVEAU

Cortical Map: human visual system

1990 1992

fMRI

1971 DAMADIAN

Discovered that biological tissues have different relaxation rates

Hirsch, J., et al

Columbia fMRI Columbia fMRI

  • II. Brain Mapping Techniques

Hirsch, J., et al

Columbia fMRI Columbia fMRI

  • 1. Functional Magnetic Resonance Imaging, fMRI
  • a. Source of signal

MAGNETIC FIELD 1: MAGNETIC FIELD 1:

Scanner Environment [1.5] T Protons align along an axis

MAGNETIC FIELD 2: MAGNETIC FIELD 2:

  • Created when a radio frequency pulse

(63.3 mgHz) is applied

  • Protons precess around the axis and create

a small current (MRI signal)

  • Protons return to aligned state when radio

frequency pulse is turned off

MAGNETIC FIELD 3: MAGNETIC FIELD 3:

  • Location of the MR signal
  • A detectable radio frequency is emitted by the

protons as they relax into their aligned state

  • The frequency is dependent upon field strength
  • Application of magnetic field gradient (mT) is

sufficient to convert detected frequencies to location

MAGNETIC FIELD 4: MAGNETIC FIELD 4:

  • Local signal change at a single voxel is

due to change in proportions of

  • xyhemoglobin/deoxyhemoglobin
  • Deoxyhemoglobin is paramagentic and

reduces the uniformity of the precessing and therefore the signal intensity

  • This change is called BOLD

The MR Signal and 4 Magnetic Fields The MR Signal and 4 Magnetic Fields

Principles of fMRI Principles of fMRI

Columbia fMRI Columbia fMRI

  • a. Source of Signal
  • a. Source of Signal

QuickTime™ and a Video decompressor are needed to see this picture.

Axial Sagittal Coronal

Hirsch, J., et al

Columbia fMRI Columbia fMRI

Vision-related cortical effects

slide-5
SLIDE 5

Page 5

Current Developments in MR are focused Current Developments in MR are focused

  • n the structure/function problem
  • n the structure/function problem

Hirsch, J., et al

Columbia fMRI Columbia fMRI

2 minutes 24 seconds 2 minutes 24 seconds

  • 40 s - - 40 s -
  • 40 s -
  • 40 s - - 40 s -
  • 40 s -

TIME

REST REST REST REST TASK TASK

R L THE BOLD SIGNAL MRI Signal Intensity

PHYSIOLOGY PHYSIOLOGY PHYSICS PHYSICS

NEURAL ACTIVATION NEURAL ACTIVATION IS ASSOCIATED WITH AN IS ASSOCIATED WITH AN INCREASE IN BLOOD FLOW INCREASE IN BLOOD FLOW O2 EXTRACTION IS O2 EXTRACTION IS RELATIVELY UNCHANGED RELATIVELY UNCHANGED RESULT: RESULT: REDUCTION IN THE REDUCTION IN THE PROPORTION OF DEOXY HGB PROPORTION OF DEOXY HGB IN THE LOCAL VASCULATURE IN THE LOCAL VASCULATURE DEOXY HGB DEOXY HGB IS PARAMAGNETIC IS PARAMAGNETIC AND DISTORTS THE LOCAL AND DISTORTS THE LOCAL MAGNETIC FIELD CAUSING MAGNETIC FIELD CAUSING SIGNAL LOSS SIGNAL LOSS RESULT: RESULT: LESS DISTORTION OF THE LESS DISTORTION OF THE MAGNETIC FIELD RESULTS IN MAGNETIC FIELD RESULTS IN LOCAL SIGNAL INCREASE LOCAL SIGNAL INCREASE

Hirsch, J., et al

Columbia fMRI Columbia fMRI

BOLD Impulse Response Model

Brief Stimulus Undershoot Initial Undershoot Peak

  • Function of blood oxygenation,

flow, volume (Buxton et al, 1998)

  • Peak (max. oxygenation) 4-6s

poststimulus; baseline after 20-30s

  • Initial undershoot can be observed

(Malonek & Grinvald, 1996)

  • Similar across V1, A1, S1…
  • … but differences across:
  • ther regions (Schacter et al 1997)

individuals (Aguirre et al, 1998)

Hirsch, J., et al

Columbia fMRI Columbia fMRI

Logothetis, N.K., Pauls, , Augath, M, Torsten, T, Oeltermann, A, Logothetis, N.K., Pauls, , Augath, M, Torsten, T, Oeltermann, A, (2001) Neurophysiological investigation of (2001) Neurophysiological investigation of the basis of the fMRI signal. Nature 412 150 the basis of the fMRI signal. Nature 412 150-

  • 157

157

BOLD ORIGIN BOLD ORIGIN

BOLD Signal corresponds to local field representation (LFP)

Hirsch, J., et al

Columbia fMRI Columbia fMRI

  • II. Brain Mapping Techniques

Hirsch, J., et al

Columbia fMRI Columbia fMRI

  • a. Source of signal
  • b. Measuremnet techniques
  • 2. Functional Magnetic Resonance Imaging, fMRI
  • 1. Positron Emission Tomography, PET
  • B. Cardiovascular Based Methods

QuickTime™ and a Radius SoftDV™ - NTSC decompressor are needed to see this picture.

Imaging While Naming Objects

QuickTime™ and a Video decompressor are needed to see this picture.

Scanner acquires the whole brain every Scanner acquires the whole brain every [4] [4] secs: secs: [26] [26] axial slices axial slices Resolution Resolution [1.5 x 1.5 x 4.5] [1.5 x 1.5 x 4.5] mm mm Each voxel is analyzed seperately Each voxel is analyzed seperately

Hirsch, J., et al

Columbia fMRI Columbia fMRI

slide-6
SLIDE 6

Page 6

COMPUTATIONS FOR COMPUTATIONS FOR f fUNCTIONAL UNCTIONAL IMAGE PROCESSING IMAGE PROCESSING

RECONSTRUCTION RECONSTRUCTION ALIGNMENT ALIGNMENT VOXEL BY VOXEL VOXEL BY VOXEL ANALYSIS ANALYSIS GRAPHICAL GRAPHICAL REPRESENTATION REPRESENTATION

Acquisition Functional Functional Brain Brain Map Map

R

+ +

+ +

Native (English) Second (French) + Center-of-Mass

“LATE” BILINGUAL (Separate Language Areas)

R

+ +

+ + Native 1 (Turkish) Native 2 (English) Common Region + Center-of-Mass

“EARLY” BILINGUAL (Overlapping Language Areas)

Kim, Relkin, Lee, & Hirsch from Nature 388, 171-174 (1997)

Columbia fMRI Columbia fMRI

Block Design

Hirsch, J., et al

Columbia fMRI Columbia fMRI

Event-Related Design

Temporal series fMRI Voxel Location voxel time course

One voxel = One test (t, F, ...)

amplitude t i m e General Linear Model

fitting statistical analysis

Hirsch, J., et al

Columbia fMRI Columbia fMRI

  • II. Brain Mapping Techniques

Hirsch, J., et al

Columbia fMRI Columbia fMRI

  • a. Source of signal
  • b. Measuremnet techniques
  • c. Computation for analysis
  • 2. Functional Magnetic Resonance Imaging, fMRI
  • 1. Positron Emission Tomography, PET
  • B. Cardiovascular Based Methods

Voxel statistics…

  • parametric
  • one sample t-test
  • two sample t-test
  • paired t-test
  • Anova
  • AnCova
  • correlation
  • linear regression
  • multiple regression
  • F-tests
  • etc…

all cases of the

General Linear Model

assume normality to account for serial correlations:

Hirsch, J., et al

Columbia fMRI Columbia fMRI

( )

1

1 1 2 1

ˆ

n n

Y Y t + − =

  • σ

two-sample t-test

standard t-test assumes independence

⇒ ignores temporal autocorrelation!

voxel time series t-statistic image SPM{t}

compares size of effect to its error standard deviation

Image intensity

Hirsch, J., et al

Columbia fMRI Columbia fMRI

slide-7
SLIDE 7

Page 7

Regression

α = 1

µ = 100

= + +

voxel time series 90 100 110 box-car reference function

  • 10 0 10

α

µ

90 100 110 Mean value Fit the GLM

  • 2 0 2

Columbia fMRI Columbia fMRI

  • II. Brain Mapping Techniques

Hirsch, J., et al

Columbia fMRI Columbia fMRI

  • a. Source of signal
  • b. Measuremnet techniques
  • c. Computation for analysis
  • d. Individual brain maps
  • 2. Functional Magnetic Resonance Imaging, fMRI
  • 1. Positron Emission Tomography, PET
  • B. Cardiovascular Based Methods

Brain Mapping and Neurosurgery:

[Fixed Effects]

Mapping Specific Functions to Locate Specific Areas

Hirsch, J., et al

Columbia fMRI Columbia fMRI R Tumor

Conventional Conventional Imaging Imaging

CC 23 (AB) Hirsch, J., et al

Columbia fMRI Columbia fMRI

Before Surgery Before Surgery

R Tumor

Conventional Conventional Imaging Imaging Functional Imaging Functional Imaging

CC 23 (AB)

Left Hand: Sensory/Motor Left Hand: Sensory/Motor Tumor

Hirsch, J., et al

Columbia fMRI Columbia fMRI

Left Hand Movement

Before Surgery Before Surgery After Surgery After Surgery

R Tumor

Conventional Conventional Imaging Imaging Functional Imaging Functional Imaging

CC 23 (AB)

Left Hand: Sensory/Motor Left Hand: Sensory/Motor Tumor

Hirsch, J., et al

Columbia fMRI Columbia fMRI

slide-8
SLIDE 8

Page 8

R

Italian English

Surgery

Before After

English Language Areas Tumor English Language Areas Italian Language Areas Tumor Italian Language Areas

a b

L A N G U A G E

Hirsch, J., et al

Columbia fMRI Columbia fMRI

SENSORY

Touch

MOTOR

Finger Thumb Tapping (active)

Standard Brain Mapping Tasks

Picture Naming

VISION

Reversing Checkerboard Listening to Words (passive)

GPoC GPrC GOi CaS GTs LANGUAGE GFi GTT

(passive) (active) (passive)

From Hirsch, J., et al; Neurosurgery 47: 711-722, 2000

Hirsch, J., et al

Columbia fMRI Columbia fMRI

  • II. Brain Mapping Techniques

Hirsch, J., et al

Columbia fMRI Columbia fMRI

  • Somatasensory Evoked Potential, SSEP
  • Direct Cortical Stimulation
  • C. Electromagnetic - Based Methods

Tag 3 Tag 5

Localization fMRI SSEP

“Twitching in 1st three digits” “Twitching of hand, focal seizure involving arm ”

Direct Cortical Stimulation

Craniotomy

Sensory Motor Mapping

From Hirsch, J., et al; An Integrated Functional Magnetic Resonance Imaging Procedure for Preoperative Mapping of Cortical Areas Associated with Tactile, Motor, Language, and Visual Functions, Neurosurgery 47: 711- 7 22, 2000. Tag 3 Tag 5

Hirsch, J., et al

Columbia fMRI Columbia fMRI

Hirsch, J., et al

Columbia fMRI Columbia fMRI

Homonculus Language Mapping

From Hirsch, J., et al; An Integrated Functional Magnetic Resonance Imaging Procedure for Preoperative Mapping of Cortical Areas Associated with Tactile, Motor, Language, and Visual Functions, Neurosurgery 47: 711

  • 7

22, 2000.

fMRI Intraoperative Stimulation Response

Speech Arrest During Counting Broca’s Area Literal paraphasic speech error during picture naming Wernicke’s Area

Hirsch, J., et al

Columbia fMRI Columbia fMRI

slide-9
SLIDE 9

Page 9

  • II. Brain Mapping Techniques

Hirsch, J., et al

Columbia fMRI Columbia fMRI

  • Somatasensory Evoked Potential, SSEP
  • Direct Cortical Stimulation
  • Magnetoencephalography, MEG
  • C. Electromagnetic - Based Methods
  • a. Source of signal

Methods to Measure Electromagnetic Activity:

Signal Source: Electrical Activity of nerve cells. What is measured on the surface of the head is the result of mostly postsynaptic potentials (excitatory or inhibitory) Many nerve cells are aligned in palisades (e.g. pyramidal cells) and post-synaptic electrical fields sum with increasing area. Typically it is thought that 100,000 adjacent neurons acting in temporal synchrony are required to produce a measurable change in the magnetic field

MEG (Magnetoencephalography) - EEC (Electroencephalography)

Hirsch, J., et al

Columbia fMRI Columbia fMRI

Relationship between currents in the brain and the magnetic field outside the head.

Based on the discovery that electrical currents generate magnetic fields: Hans Christian Oersted, a Danish physicist (early

  • 19th. century)

A current source with strength Q causes a current flow Jv within the brain. The current flow produces a potential difference V on the scalp: (measured by EEG) And a magnetic field B

  • utside of the head:

(measured by MEG)

from: www.Aston.ac.uk/psychology/ meg/meg/intro/magfield.htm

B B J Jv

v Q Q

V V

Hirsch, J., et al

Columbia fMRI Columbia fMRI

  • II. Brain Mapping Techniques

Hirsch, J., et al

Columbia fMRI Columbia fMRI

  • Somatasensory Evoked Potential, SSEP
  • Direct Cortical Stimulation
  • Magnetoencephalography, MEG
  • C. Electromagnetic - Based Methods
  • a. Source of signal
  • b. Measurement techniques

Magnetoencephalography, MEG

Tiny magnetic fields produced by brain activity (10-13 Teslas) can be measured using Superconducting Quantum Interference Devices (SQUIDs). SQUIDS operate at superconducting temperatures (-269oC). Sensors are placed in a dewar containing liquid helium. Stimulus – evoked neuromagnetic signals are recorded by an array of detectors. The spatial location of the source is inferred by mathematical modeling of the magnetic field pattern.

Hirsch, J., et al

Columbia fMRI Columbia fMRI

  • II. Brain Mapping Techniques

Hirsch, J., et al

Columbia fMRI Columbia fMRI

  • Somatasensory Evoked Potential, SSEP
  • Direct Cortical Stimulation
  • Magnetoencephalography, MEG
  • C. Electromagnetic - Based Methods
  • a. Source of signal
  • b. Measurement techniques
  • c. Computation for analysis
slide-10
SLIDE 10

Page 10

Somatosensory evoked magnetic signals in response to tactile stimulation of the contralateral index finger Isofield contour maps at the time of maximal response (50 msec) to the tactile stimulation

Neuro magnetic response

  • ccurs about 50 msec after

the stimulation. The field pattern is dipolar with clearly defined regions

  • f entering (solid lines) and

emerging (dashed lines) magnetic flux.

Hirsch, J., et al

Columbia fMRI Columbia fMRI

Magnetic field strength in left hemisphere sensors over time

Liina Pylkkanen, Alec Marantz, 2002

Looking at words

Hirsch, J., et al

Columbia fMRI Columbia fMRI

  • II. Brain Mapping Techniques

Hirsch, J., et al

Columbia fMRI Columbia fMRI

  • Somatasensory Evoked Potential, SSEP
  • Direct Cortical Stimulation
  • Magnetoencephalography, MEG
  • Electroencephalography, EEG
  • C. Electromagnetic - Based Methods
  • a. Source of signal
  • b. Measurement techniques

Electroencephalography

Hirsch, J., et al

Columbia fMRI Columbia fMRI

  • II. Brain Mapping Techniques

Hirsch, J., et al

Columbia fMRI Columbia fMRI

  • Somatasensory Evoked Potential, SSEP
  • Direct Cortical Stimulation
  • Magnetoencephalography, MEG
  • Electroencephalography, EEG
  • C. Electromagnetic - Based Methods
  • a. Source of signal
  • b. Measurement techniques
  • c. Computation for analysis

Averaged Activity profiles during bilateral finger movement Electrode Array for EEG

Electroencephalography

Hirsch, J., et al

Columbia fMRI Columbia fMRI

slide-11
SLIDE 11

Page 11

Mapping specific functions to understand a neural system

  • Normalized Brain

Normalized Brain

  • Inferences to general population

Inferences to general population [Random effects] [Random effects]

  • C. Integration of Brain Mapping Technique

Hirsch, J., et al

Columbia fMRI Columbia fMRI

Hirsch, J., et al

Columbia fMRI Columbia fMRI

Labeling of Active Brain Areas Labeling of Active Brain Areas

Functional Brain Functional Brain Atlas Brain Atlas Brain

transfer transfer activity activity labels labels

GPrC GPrC 4 4 GFs GFs 6 6 GFd GFd 6 6 GFs GFs 6 6 GRC GRC 4 4 LPs LPs 7 7 c,E c,E b,E b,E a,E,60, a,E,60,-

  • a

a b,E,60 b,E,60 c,E,60 c,E,60 b,G,60 b,G,60 Name Name BA BA Sector Sector

Hirsch, J., et al

Columbia fMRI Columbia fMRI

Hirsch, R-Moreno, Kim, Interconnected large-scale systems for three fundamental cognitive tasks revealed by functional MRI. Journal of Cognitive Neuroscience, 13(3), 389-405, 2001.

Map of Human Language System

Medial Frontal Gyrus Superior Temporal Gyrus Inferior Frontal Gyrus Inferior Frontal Gyrus 6 22 44 45 9 57 49 40

  • 6
  • 2

6 10 25 53 9 25 8 Anatomical Region BA z y x Center of mass

Hirsch, J., et al

Columbia fMRI Columbia fMRI

Mission

To establish a collaborative and multi-investigator neuroimaging research environment focused on education, medical applications, and the study of brain, behavior, and therapy-induced cortical effects aimed at the systems of the brain that underlie cognition, perception, and action.

Columbia fMRI Columbia fMRI

Functional MRI Research Center Functional MRI Research Center

Department of Radiology Center for Neurobiology and Behavior Columbia University Medical Center

Hirsch, J., et al

Columbia fMRI Columbia fMRI