
SLIDE 1
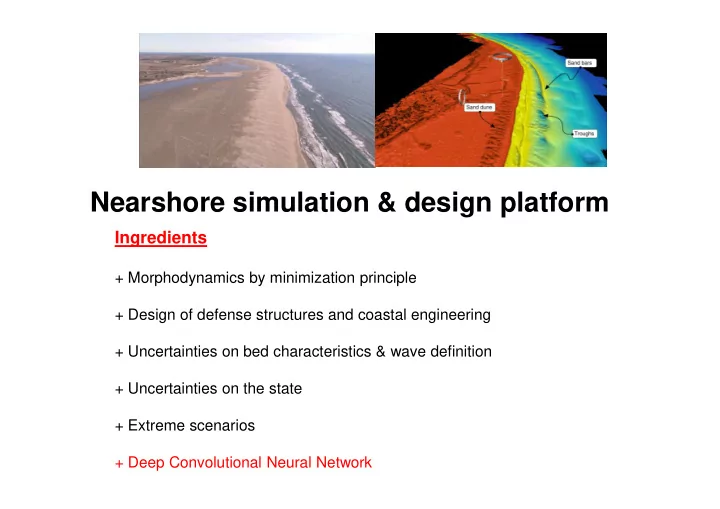
Nearshore simulation & design platform
Ingredients
+ Morphodynamics by minimization principle + Design of defense structures and coastal engineering + Uncertainties on bed characteristics & wave definition + Uncertainties on the state + Extreme scenarios + Deep Convolutional Neural Network