
SLIDE 1
Nearterm GDP slides.ppt Ref #6094147 1.0 1
Near-term GDP forecast
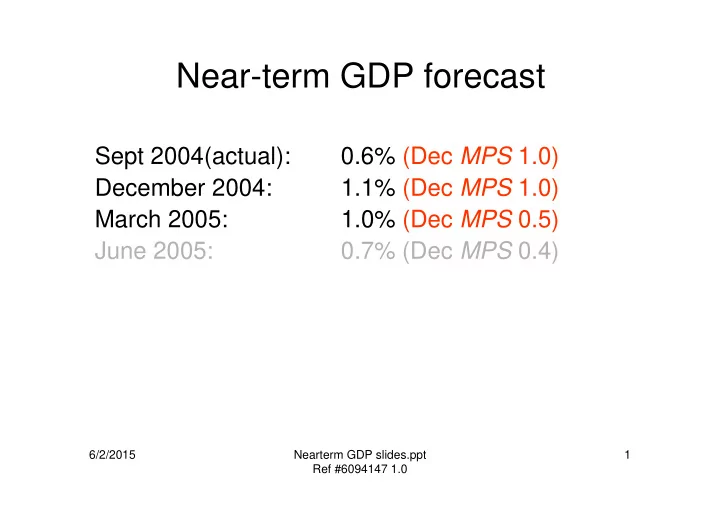
Sept 2004(actual): 0.6% (Dec MPS 1.0) December 2004: 1.1% (Dec MPS 1.0) March 2005: 1.0% (Dec MPS 0.5) June 2005: 0.7% (Dec MPS 0.4)
6/2/2015
Near-term GDP forecast Sept 2004(actual): 0.6% (Dec MPS 1.0) - - PowerPoint PPT Presentation
Near-term GDP forecast Sept 2004(actual): 0.6% (Dec MPS 1.0) December 2004: 1.1% (Dec MPS 1.0) March 2005: 1.0% (Dec MPS 0.5) June 2005: 0.7% (Dec MPS 0.4) 6/2/2015 Nearterm GDP slides.ppt 1 Ref #6094147 1.0 December 2004 GDP highlights
Nearterm GDP slides.ppt Ref #6094147 1.0 1
6/2/2015
Nearterm GDP slides.ppt Ref #6094147 1.0 2
6/2/2015
Nearterm GDP slides.ppt Ref #6094147 1.0 3
Dec-04 Mar-05
1.0 1.0 Indicator models (variables used)
2.0
0.9
1.2 1.1
1.4
0.9
1.4 8 Capacity Utilisation 1.8 0.8
1.2 1.4
1.1 1.2
1.1 Simple average 1.3 1.1 Median forecast 1.2 1.1 Actual forecast selected September MPS 1.1 1.0 1.0 0.5
Table 2.2.1: Indicators for 04Q4 and 05Q1 production GDP
December MPS
6/2/2015
Nearterm GDP slides.ppt Ref #6094147 1.0 4
6/2/2015
Nearterm GDP slides.ppt Ref #6094147 1.0 5
6/2/2015
Nearterm GDP slides.ppt Ref #6094147 1.0 6
2004 2002 2000 1998 1996 1994 3 2 1
0.8 0.6 0.5 0.3 0.2 0.0
% % Output gap (Dec MPS projection) Output gap (current projection) Difference (current less Dec MPS) (RHS)
6/2/2015
Nearterm GDP slides.ppt Ref #6094147 1.0 7
2004 2003 2002 2001 2000 95 93 91 89 87 85 83 95 93 91 89 87 85 83 % %
Dec MPS
C apacity utilisation 2004 2003 2002 2001 2000 65 52 39 26 13 65 52 39 26 13 % %
Dec MPS
D ifficulty finding skilled labour 2004 2003 2002 2001 2000 45 40 35 30 25 20 15 10 5 45 40 35 30 25 20 15 10 5 % %
Dec MPS
D ifficulty finding unskilled labour 2004 2003 2002 2001 2000 7 6 5 5 4 4 3 7 6 5 5 4 4 3 % %
Dec MPS
U nem ploym ent rate
2.2.15: Capacity Utilisation 2.2.16: Diff finding skilled labour 2.2.17: Diff finding unskilled labour 2.2.18: Unemployment
6/2/2015