Natures light show: Saturns aurora Sarah Badman Lancaster - - PowerPoint PPT Presentation

nature s light show saturn s aurora
SMART_READER_LITE
LIVE PREVIEW

Natures light show: Saturns aurora Sarah Badman Lancaster - - PowerPoint PPT Presentation

Natures light show: Saturns aurora Sarah Badman Lancaster University, UK Cassini/UVIS images of Saturns northern aurora (Badman et al., 2013) Outline How the solar wind affects Saturns magnetosphere Why do we care?


slide-1
SLIDE 1

Nature’s light show: Saturn’s aurora

Sarah Badman Lancaster University, UK

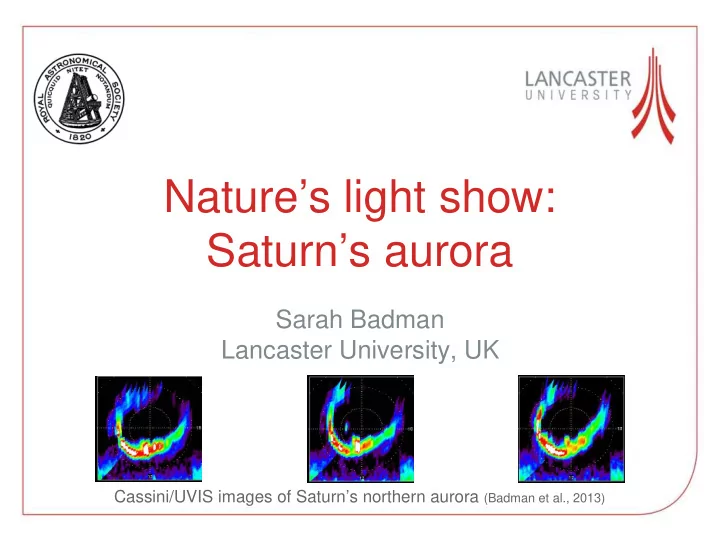
Cassini/UVIS images of Saturn’s northern aurora (Badman et al., 2013)

slide-2
SLIDE 2

2

Outline

  • How the solar wind affects Saturn’s magnetosphere
  • Why do we care?
  • Saturn’s aurora: a global view
  • Recent Cassini auroral discoveries
  • What are we looking for next?
  • The 2013 and 2014 auroral campaigns
  • Summary
slide-3
SLIDE 3

3

Science Objective

  • ‘To characterise the structure of the magnetosphere and its

interactions with the solar wind, Saturn’s moons and rings.’

NASA

  • We are studying how the energy from the Sun spreads

through the solar system, and how it affects the local environment of the planets.

slide-4
SLIDE 4

4

Saturn’s magnetosphere

Kivelson (2006)

slide-5
SLIDE 5

5

The solar wind interaction

Hughes (1995)

At the magnetopause the planet’s magnetic field lines ‘break’ open and connect with the interplanetary field carried by the solar wind => ‘open’ field lines

NASA

  • The solar wind stirs the planetary plasma and magnetic field.
slide-6
SLIDE 6

6

The solar wind interaction

  • The solar wind interaction allows particles and energy to be

exchanged between the magnetosphere and surrounding space.

  • If the solar wind conditions change (speed, pressure, field
  • rientation) then the interaction with the magnetosphere will

change.

  • How can we see it?

NASA

slide-7
SLIDE 7

7

Saturn’s aurora

  • ←Saturn’s ultraviolet

aurora seen by Cassini/UVIS Saturn’s infrared aurora seen by Cassini/VIMS→ ←Saturn’s visible aurora seen by Cassini/ISS

slide-8
SLIDE 8

8

Saturn’s aurora

Credit: OpenStax College

  • The aurorae are generated when particles crash into the

planet’s atmosphere and cause it to glow.

  • The particles travel down magnetic field lines, so the aurorae

show us the footprint of the magnetic field in the ionosphere.

slide-9
SLIDE 9

What are the aurorae?

  • Particles crash into a planet’s atmosphere causing it to glow.
  • Aurorae have been observed at the Earth, Jupiter, Saturn,

Uranus, Neptune and Ganymede.

  • They occur in the polar regions at the footprints of magnetic

field lines and usually form an oval around the pole.

↑Aurora seen from the ground in

  • Alaska. O 558 nm.

(Credit: Bud Kuenzli) Aurora seen from the ISS (NASA)↓ Aurora seen from the IMAGE satellite. N2 / O / H. (NASA) ↓

slide-10
SLIDE 10

Aurorae through the solar system

Feldman et al. (2000) NASA/J.T. Clarke NASA/IMAGE

slide-11
SLIDE 11

11

Saturn’s aurora

Pryor et al. (2011)

Main oval Enceladus spot Poleward arcs

  • r ‘bifurcations’

←Two views from Cassini/UVIS looking down on the northern pole with the Sun to the left. To the Sun

  • The aurorae are generated when particles crash into the

planet’s atmosphere and cause it to glow.

  • The particles travel down magnetic field lines, so the aurorae

show us the footprint of the magnetic field in the ionosphere

  • Saturn’s aurora has different components:
slide-12
SLIDE 12

12

Saturn’s aurora

  • The aurorae are generated when particles crash into the

planet’s atmosphere and cause it to glow.

  • The particles travel down magnetic field lines, so the aurorae

show us the footprint of the magnetic field in the ionosphere

  • Saturn’s aurora has different components:

This ‘dayside’ region represents the field lines at the front of the magnetosphere, i.e. where the solar wind is impacting. Two views from Cassini/UVIS looking down on the northern pole with the Sun to the left.

Pryor et al. (2011)

slide-13
SLIDE 13

13

Saturn’s aurora

  • The aurorae are generated when particles crash into the

planet’s atmosphere and cause it to glow.

  • The particles travel down magnetic field lines, so the aurorae

show us the footprint of the magnetic field in the ionosphere

  • Saturn’s aurora has different components:

The nightside region represents the field lines in the magnetotail: where mass is released downtail and field lines start to move back towards the planet. Two views from Cassini/UVIS looking down on the northern pole with the Sun to the left.

Pryor et al. (2011)

slide-14
SLIDE 14

14

Unique science opportunities

  • This means that Cassini can tell us what’s happening locally

and, simultaneously, how that fits in with what’s happening globally.

  • A great example of this is auroral imaging with simultaneous

in situ fields and particles measurements.

  • Cassini’s long orbital tour also allows us to study long-term

trends in the aurora and its response to solar wind activity.

  • Cassini’s suite of instruments

include those which measure the local environment (e.g. particle detectors and magnetometer) as well as those which remote sense the more distant environment (e.g. imagers).

NASA/JPL-Caltech/SSI/G. Ugarkovic

slide-15
SLIDE 15

15

1: Aurora and energetic particles

  • Cassini/VIMS took a mosaic of the northern infrared aurora.
  • At the same time it was travelling across magnetic field lines

mapping down to the bright arcs observed. 15 Nov 2008

Badman et al. (2012)

Cassini’s footprint in the ionosphere

slide-16
SLIDE 16

16

15 Nov 2008

energetic electrons electrons waves protons currents

  • While the auroral arcs are

related to electrons travelling down into the atmosphere, here we see bursts of energetic particles travelling up away from the atmosphere.

  • Related to the dark regions

between the auroral arcs?

Badman et al. (2012)

Bursts!

1: Aurora and energetic particles

slide-17
SLIDE 17

17

2: Time-development of the aurora

  • Sequence of UVIS observations of the northern aurora.

19 July 2008

Badman et al. (2013)

03:00 - 13:00 UT

slide-18
SLIDE 18

18

  • 07 UT: Cassini was

inside the magnetopause (MP) and detected electrons escaping from Saturn’s magnetosphere.

  • 10 UT: Cassini was now
  • utside the magnetopause

(MP) and again detected electrons escaping from Saturn’s magnetosphere. 19 July 2008

  • This suggests the field lines were ‘open’ to the solar wind.

Badman et al. (2013)

2: Time-development of the aurora

slide-19
SLIDE 19

19

  • What auroral features were seen at the footprint of the

magnetic field lines? 19 July 2008 (a) (b)

  • Intensification of the dayside

auroral arc: signature of coupling between the solar wind and the magnetosphere.

  • Bifurcated arcs move

poleward: signature of bursts

  • f field line reconnection and

their subsequent poleward motion.

  • The solar wind interaction changes with time.

Badman et al. (2013)

2: Time-development of the aurora

slide-20
SLIDE 20

20

3: Flashing of auroral arcs

  • These UVIS images show

some dayside auroral arcs.

  • Arcs a and b brighten and

then dim twice while Cassini was watching.

  • This is related to repeated

‘breaking’ of the planetary field lines, producing a flash each time.

  • The solar wind keeps

interacting with the same field lines.

Radioti et al. (2013)

21 Jan 2009

slide-21
SLIDE 21

21

4: Aurora across the spectrum

  • All Cassini’s remote sensing instruments were observing

together and saw blobs rotating around: (a) (b) (c) Auroral arcs at infrared and ultraviolet wavelengths. (d) Radio emission coming from the same place. (e) Energetic plasma moving through the corresponding region of the magnetosphere.

Lamy et al. (2013)

28 Jan 2009

slide-22
SLIDE 22

22

The role of the Sun

  • All these observations show the influence of the Sun on

Saturn’s magnetosphere and atmosphere.

  • What happens if the Sun’s activity increases?

Hughes (1995) NASA

slide-23
SLIDE 23

23

Has the solar activity changed?

  • The observations just shown occurred when solar activity was

a minimum in its 11 year cycle, as indicated in this plot of sunspot number.

  • Now we are at solar maximum and the Sun is much more

active (although still quiet compared to 11 years ago).

slide-24
SLIDE 24

24

So what’s next?

  • In early 2013, Cassini again moved into an inclined orbit.
  • This allows the best view of the aurora since before equinox

in 2009.

  • In spring 2013 there was a large auroral campaign: monitoring

Saturn’s aurora using Cassini, the Hubble Space Telescope, and ground-based infrared telescopes e.g. NASA IRTF.

NASA NASA NASA/JPL-Caltech

slide-25
SLIDE 25

25

Aims of the auroral campaign

  • Discover how the solar wind drives Saturn’s magnetosphere

and aurora when the solar activity is high. Saturn’s southern aurora→ Solar wind speed→ Interplanetary magnetic field strength (carried in the solar wind)→

Crary et al. (2005)

  • Auroral ‘storms’ have been observed when high pressure

regions of the solar wind crash into Saturn. Storm!

slide-26
SLIDE 26

26

Aims of the auroral campaign

  • Discover how the solar wind drives Saturn’s magnetosphere

and aurora when the solar activity is high.

Radioti et al. (2013)

  • What signatures of the solar wind interaction will we see in the

dayside aurora? Bigger, brighter, more often, or something different?

Badman et al. (2013) Badman et al. (2012)

slide-27
SLIDE 27

27

Aims of the auroral campaign

  • Compare the northern and southern aurora using the Hubble

Space Telescope looking at the north, and Cassini looking at the south.

←The best simultaneous view of both hemispheres we’ve had so far, taken by Hubble in 2009.

Credit: J.D. Nichols

The view in 2013 and 2014 using Hubble and Cassini!→

slide-28
SLIDE 28

28

Aims of the auroral campaign

  • Compare the spatial and relative intensity distributions of H3+

emission with those of H and H2.

  • Obtain simultaneous observations of the aurora in the

northern and southern hemispheres, or on the northern dayside and nightside.

  • Observe the temporal development of auroral storms and
  • ther dynamics.
  • Compare observed auroral intensity and morphology with in

situ detection of field-aligned currents.

  • Detect any post-equinox rotational modulation of auroral

intensity, and compare to models based on magnetic field data.

  • Monitor long term trends in auroral intensity in both

hemispheres to isolate seasonal and magnetic field dependences.

Results coming soon!

slide-29
SLIDE 29

29

Summary

  • The interaction between the solar wind and Saturn’s

magnetosphere is important for the exchange of mass and momentum.

  • It’s difficult to measure this interaction using single point

measurements from one spacecraft in the huge magnetosphere.

  • We can use auroral images to show us the global picture.

NASA

slide-30
SLIDE 30

30

Summary

  • We have shown examples of how Saturn’s aurorae reveal a

variable interaction with the solar wind:

  • auroral arcs with energetic

ions and electrons

  • time evolution of auroral arcs
  • flashing of auroral arcs
  • moving blobs
  • How will the aurorae look at solar maximum? Will we see

more bright polar events?

  • Auroral campaign results coming soon...