
SLIDE 1
National Laboratory Presentation to ETEBA LeAnne Stribley - - PowerPoint PPT Presentation
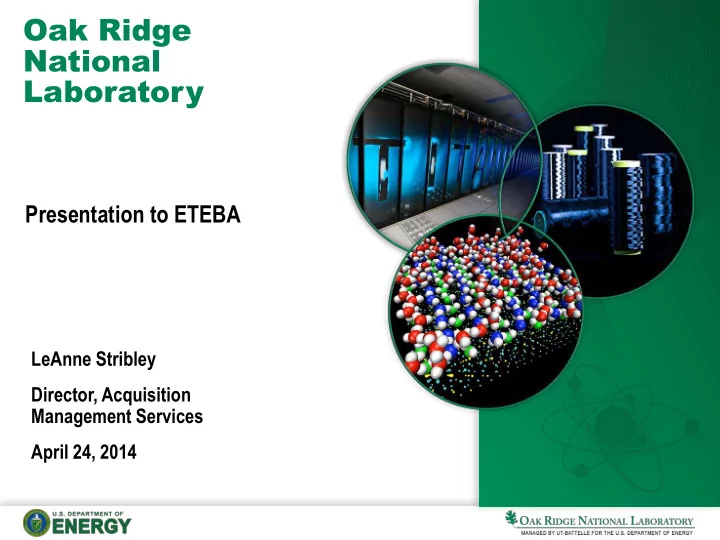
Oak Ridge National Laboratory Presentation to ETEBA LeAnne Stribley Director, Acquisition Management Services April 24, 2014 2 Presentation name ORNL is well positioned for the near term The Bipartisan Budget Agreement passed in
2 Presentation name
3 Presentation name
4 Presentation name
Marketplace 57,724 Marketplace P-Cards 33,299 P-Cards PO's 25,594 PO's TOTAL 116,617 TOTAL
TRANSACTIONS
$592,748,490 $641,871,467
DOLLARS
$31,052,430 $18,070,547
PO's 21.9% P-Card 28.6% Market- place 49.5%
PO's 92.3% P-Card 2.8% Market- place 4.8%
5 Presentation name
DOLLARS TRANSACTIONS
PO's: $592.8m 25,594 P-Cards: $18.1m 33,299 Marketplace: $31.1m 57,724 Admin Services 2.8% Computers 14.7% Equip / Supplies 61.8% Infrastructure Support 2.1% Laboratory 17.6% Lease of Equipment 0.0% MPO / InterAgency 0.8% Waste / Containers 0.2% Admin Services 2% Computers 25% Equip / Supplies 52% Infrastructure Support 2% Laboratory 18% Lease of Equipment 0% MPO / InterAgency 0% Waste / Containers 1%
6 Presentation name
DOLLARS TRANSACTIONS
PO's: $592.8m 25,594 P-Cards: $18.1m 33,299 Marketplace: $31.1m 57,724
Admin Services 0.0% Computers 43.6% Equipment / Supplies 38.1%
Infrastructure Support
1.8% Laboratory 16.2% Waste / Containers 0.3% Admin Services 0.0% Computers 27.4% Equipment / Supplies 54.5%
Infrastructure Support
0.3% Laboratory 17.1% Waste / Containers 0.6%
7 Presentation name
DOLLARS TRANSACTIONS
PO's: $592.8m 25,594 P-Cards: $18.1m 33,299 Marketplace: $31.1m 57,724 Admin Services 8.9% Computers 9.5% Equipment / Supplies 17.3% Independent Subcontractors 0.9% Infrastructure Support 19.8% Laboratory 22.0% Lease of Equipment 0.6% MPO / InterAgency 14.6% Universities 5.7% Waste / Containers 0.7% Admin Services 14.9% Computers 7.7% Equipment / Supplies 3.9% Independent Subcontractors 0.2% Infrastructure Support 21.2% Laboratory 20.3% Lease of Equipment 3.7% MPO / InterAgency 21.4% Universities 6.6% Waste / Containers 0.1%
8 Presentation name
O N D J F M A M J J A S YTD 9,872 9,929 7,892 8,990 10,022 9,560 9,667 10,162 9,484 9,498 13,333 12,652 121,061 $53.1 $34.6 $61.0 $31.9 $27.1 $64.6 $35.2 $71.4 $54.7 $73.2 $96.0 $161.2 $764.1
Includes P-Cards. PM / FY12 by Month.xlsx Data Source: WM/Backupdata.xls 10/8/2012 ACTIONS DOLLARS
$0.0 $50.0 $100.0 $150.0 $200.0 2,000 4,000 6,000 8,000 10,000 12,000 14,000 16,000 O N D J F M A M J J A S
$ (millions) Actions
DOLLARS ACTIONS
YTD - Sep 2012
9 Presentation name
O N D J F M A M J J A S YTD 10,914 9,171 8,398 9,413 9,750 9,011 9,241 9,384 8,619 9,641 11,694 11,381 116,617 $65.3 $41.4 $29.5 $37.6 $57.8 $33.0 $44.3 $55.5 $70.0 $40.6 $68.6 $98.6 $641.9
Includes P-Cards. PM / FY13 by Month.xlsx Data Source: WM/Backupdata.xls 10/2/2013 ACTIONS DOLLARS
$0.0 $50.0 $100.0 $150.0 $200.0 2,000 4,000 6,000 8,000 10,000 12,000 14,000 16,000 O N D J F M A M J J A S
$ (millions) Actions
DOLLARS ACTIONS
YTD - Sep 2013
10 Presentation name
OCT NOV DEC JAN FEB MAR APR MAY JUN JUL AUG SEP
4,027 8,082 1 1 ,887 1 6,803 21 ,700 26,699 5,403 1 0,636 1 5,447 21 ,562 27,706 33,883 $2,429,987 $1 4,897,336 $1 9,979,1 85 $39,551 ,466 $45,382,495 $67,845,925 $7,51 5,435 $26,263,51 7 $35,831 ,997 $58,01 0,467 $68,689,31 1 $98,475,699
Base = Competition Code not ZX07, ZX08, ZX12, ZX13 - Excludes BESC Awards. *Includes Educational. SELA/Competitive.xlsx Data Source: BW-7 Report Procurement Competitively Placed 4/1/2014
Cumulative
ALL Competitive Trans. ALL Comp Base Trans. GT $150k Comp Funded GT $150k Comp Base Funded
74.5 76.0 77.0 77.9 78.3 78.8 32.3 56.7 55.8 68.2 66.1 68.9 20 40 60 80 100
O N D J F M A M J J A S Percentage (%)
Transactions Dollars
Internal Goal = >80% of 'all' Transactions Goal = >60% of Awards GT $150,000
YTD - Mar 2014
11 Presentation name
12 Presentation name
FY2014 YTDHistorical Data: FY 00* FY 01 FY 02 FY 03 FY 04 FY 05 FY 06 FY 07 FY 08 FY 09 FY 10 FY 11 FY 12 FY 13 SB Base SB=Small Business 54.57 48.41 49.22 54.1 62.7 50.79 57.84 58.47 62.94 49.64 59.24 54.1 52.71 58.36
148.4M
SDB=Small Disadvantaged 9.77 7.55 6.42 6.24 9.23 7.09 10.54 9.26 11.13 6.82 10.01 9.81 12.00 12.08 Educ Base WOB=Small Woman-Owned 8.51 7.45 12.21 8.8 10.31 7.86 11.35 12.33 14.62 9.7 12.41 11.49 13.28 12.55
19.6M
HUBZone=Hist. Underutilized Business Zones 0.05 0.24 0.37 1.97 4.42 3.21 7.35 6.74 6.96 3.53 4.42 2.84 3.88 3.18 Total Proc Vet-Owned=Veteran-Owned Sm Business N/R 0.32 0.82 1.19 3 1.49 4.07 3.52 6.12 4.89 5.93 5.48 4.23 6.18
237.3M
SD-Vet=Serv-Disabled Vet-Owned Sm Business N/R 0.037
0.028 0.14 0.115 1.652 1.023 2.54 2.86 3.9 3.25 2.16 3.23 Base for SB, SDB, WOB & HUBZone %s excludes Foreign, GOVT, INTG, IGT & Affiliates (FY05-10 includes P-Cards) Data Source: 2096 & Proc Stats 2. * UT-Battelle contract started April 1, 2000. 6 months of data only. Base revised in FY05 & FY07. 2SELA/SE Combined.xlsx 4/1/2014
10 20 30 40 50 60 70 80 90 100 Percentage
YTD - Mar 2014
% (Percentage)
SB Goal =>54% YTD $ 67.9M SDB Goal =>8% YTD $ 11.4M WOB Goal =>10% YTD $ 10.6M HUBZone Goal =>3% YTD $ 4.2M Vet-Owned Goal =>4.5% YTD $ 10.4M SD-Vet Goal =>3% YTD $ 6.5M LB YTD $ 80.5M
13 Presentation name
14 Presentation name
15 Presentation name
16 Presentation name
17 Presentation name
18 Presentation name
19 Presentation name
20 Presentation name
21 Presentation name
MANAGED BY UT-BATTELLE FOR THE DEPARTMENT OF ENERGY
22 Presentation name