name date period unit 3 numbers large and small ppt
play

#___ Name____________________________________ Date_________ - PDF document

#___ Name____________________________________ Date_________ Period_____ UNIT 3: Numbers Large and Small PPT Assignment Use With PPT slides I. Accuracy Precision and Error Accuracy refers to how close a measured value is to an accepted value:


  1. #___ Name____________________________________ Date_________ Period_____ UNIT 3: Numbers Large and Small PPT Assignment Use With PPT slides I. Accuracy Precision and Error 
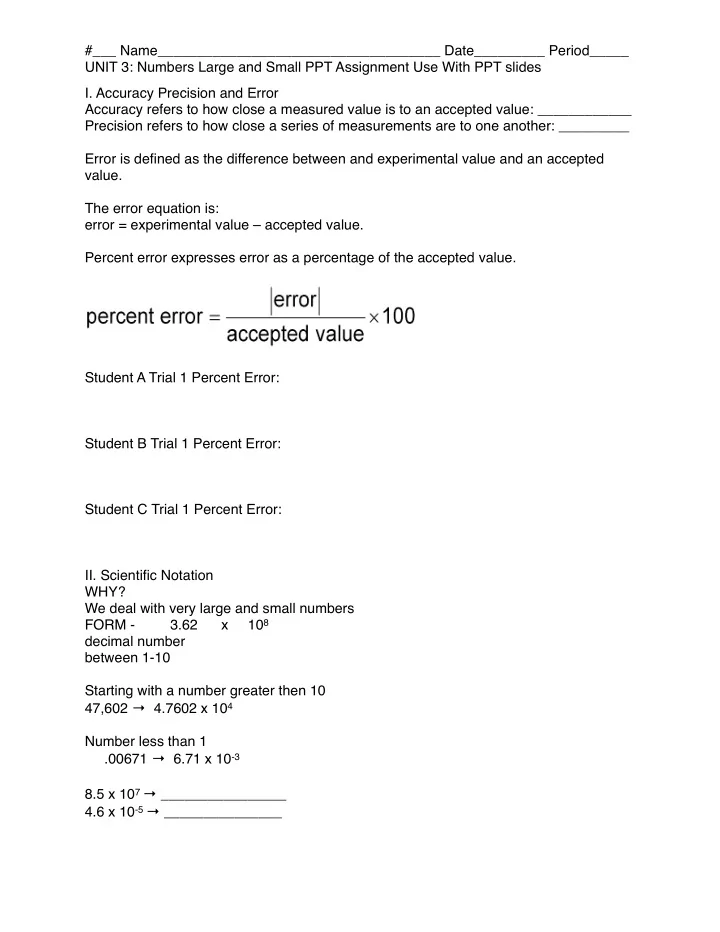
Accuracy refers to how close a measured value is to an accepted value: ____________ Precision refers to how close a series of measurements are to one another: _________ Error is defined as the difference between and experimental value and an accepted value. The error equation is: error = experimental value – accepted value. Percent error expresses error as a percentage of the accepted value. Student A Trial 1 Percent Error: Student B Trial 1 Percent Error: Student C Trial 1 Percent Error: II. Scientific Notation WHY? We deal with very large and small numbers FORM - 3.62 x 10 8 decimal number between 1-10 Starting with a number greater then 10 47,602 → 4.7602 x 10 4 Number less than 1 .00671 → 6.71 x 10 -3 8.5 x 10 7 → ________________ 4.6 x 10 -5 → _______________

  2. #___ Name____________________________________ Date_________ Period_____ UNIT 3: Numbers Large and Small PPT Assignment Use With PPT slides The number of places moved equals the value of the exponent. The exponent is positive when the decimal moves to the left and negative when the decimal moves to the right. 800 = 8 × 10 2 0.0000343 = 3.43 × 10 -5 How many “sig figs” are in the numbers listed above? III. Significant Figures - each of the digits of a number that are used to express it to the required degree of accuracy Example Question: How many significant figures are in the following numbers? 4.321 g 4 SF 306 s 3 SF � � 0 ʼ s between non 0 ʼ s are significant digit 1209 m 4 SF 0.000017 L 2 SF 001235 nm 4 SF � � 0 ʼ s at beginning are never significant 907.0 km 4 SF 2.4050 x 10E-4 kg 5 SF � � 0 ʼ s at end of number are always significant IF there ʼ s 300,100,000 g 4 SF � � a decimal point Exact numbers do not affect the number of significant numbers in the answer Example: Rules for Significant Figures Rule 1: Nonzero numbers are always significant. Rule 2: Zeros between nonzero numbers are always significant. Rule 3: All final zeros to the right of the decimal are significant. Rule 4: Placeholder zeros are not significant. To remove placeholder zeros, rewrite the number in scientific notation. Rule 5: Counting numbers and defined constants have an infinite number of significant figures. The Atlantic-Pacific Rule: "If a decimal point is Present, ignore zeros on the Pacific (left) side. If the decimal point is Absent, ignore zeros on the Atlantic (right) side. Everything else is significant." If you're not in the Americas, you may prefer the following less colorful way to say the same thing: 1. � Ignore leading zeros. 2. � Ignore trailing zeros, unless they come after a decimal point. 3. � Everything else is significant.

  3. #___ Name____________________________________ Date_________ Period_____ UNIT 3: Numbers Large and Small PPT Assignment Use With PPT slides Example Question: How many significant figures are in the following numbers? a. 0.000010 L � � __ b. 9507.0 km �� � __ c. 8.400900 x 10 -8 kg � __ d. 700,103,000 g � � __ Hint: If a decimal point is included, count the zeros. If there is no decimal point, the zeros do not count. Do not start counting until the first nonzero digit is reached as viewed from left to right. IV. Multiplying (7.86 x 10⁻⁸) (4.29 x 10⁻²) = 33.719 x 10⁻⁹ 7.86 4.29 EE EE maybe +/- +/- 8 2 7.86 -08 4.29 -02 = 3.3719 x 10 -9 (7.2 x 10 12 ) (6.01 x 10 -21 ) = _______________ 7.2 12 6.01 -21 = _______________ Multiplication and Division To multiply, multiply the coefficients, then ADD the exponents. To divide, divide the coefficients, then SUBTRACT the exponent of the divisor from the exponent of the dividend. Example Problems: a. (3 x 10 7 km) x (3 x 10 7 km) b. (2 x 10 -4 mm) x (2 x 10 -4 mm) c. (90 x 10 14 kg) ÷ (9 x 10 12 L) d. (12 x 10 -4 m ) ÷ (3 x 10 -4 s) Answers a. b. c. d. Division 1.29 x 10 2 = 6.74 x 10⁻⁴ Addition and Subtraction Involving Measured Values Exponents must be the same. Rewrite values with the same exponent. Add or subtract coefficients.

  4. #___ Name____________________________________ Date_________ Period_____ UNIT 3: Numbers Large and Small PPT Assignment Use With PPT slides Example Questions (keep answers in scientific notation): a. 5.10 x 10 20 + 4.11 x 10 21 b. 6.20 x 10 8 - 3.0 x 10 6 c. 2.303 x 10 5 - 2.30 x 10 3 d. 1.20 x 10 -4 + 4.7 x 10 -5 e. 6.20 x 10 -6 + 5.30 x 10 -5 f. 8.200 x 10 2 - 2.0 x 10 -1 Answers a. b. � � c. � d. � � e. � f. � V. Rules for rounding Rule 1: If the digit to the right of the last significant figure is less than 5, do not change the last significant figure. Rule 2: If the digit to the right of the last significant figure is greater than 5, round up to the last significant figure Round each number to five significant figures. Write your answers in scientific notation. a. 0.000249950 b. 907.0759 c. 24,501,759 d. 300,100,500 a. b. c. d. Rounding Numbers Calculators are not aware of _________________________ . Answers should not have more significant figures than the original data with the fewest figures, and should be rounded. Addition and Subtraction Round numbers so all numbers have the same number of digits to the right of the decimal. Multiplication and Division Round the answer to the same number of significant figures as the original measurement with the fewest significant figures.

  5. #___ Name____________________________________ Date_________ Period_____ UNIT 3: Numbers Large and Small PPT Assignment Use With PPT slides Examples: 3.43 cm + 5.2 cm = ________ 6.210 L + 3 L = ________ � Example Questions: Complete the following calculations. Round off your answers as needed. a. 52.6 g + 309.1 g + 77.214 g b. 927.37 mL - 231.458 mL c. 245.01 km x 2.1 km d. 529.31 m ÷ 0.9000 s Answers a. b. c. d. VI. A graph is a visual display of data that makes trends easier to see than in a table. A circle graph, or pie chart, has wedges that visually represent percentages of a fixed whole. Bar graphs are often used to show how a quantity varies across categories. On line graphs, independent variables are plotted on the x-axis and dependent variables are plotted on the y-axis. If a line through the points is straight, the relationship is linear and can be analyzed further by examining the slope. Interpolation is reading and estimating values falling between points on the graph. Extrapolation is estimating values outside the points by extending the line. This graph shows important ozone measurements and helps the viewer visualize a trend from two different time periods. Uncertainty in Measurements Why is there uncertainty? Due to nature of the measuring devise. Precision and Accuracy Often, precision is limited by the tools available. Significant figures include all known digits plus one uncertain digit.

Download Presentation
Download Policy: The content available on the website is offered to you 'AS IS' for your personal information and use only. It cannot be commercialized, licensed, or distributed on other websites without prior consent from the author. To download a presentation, simply click this link. If you encounter any difficulties during the download process, it's possible that the publisher has removed the file from their server.

Recommend


More recommend