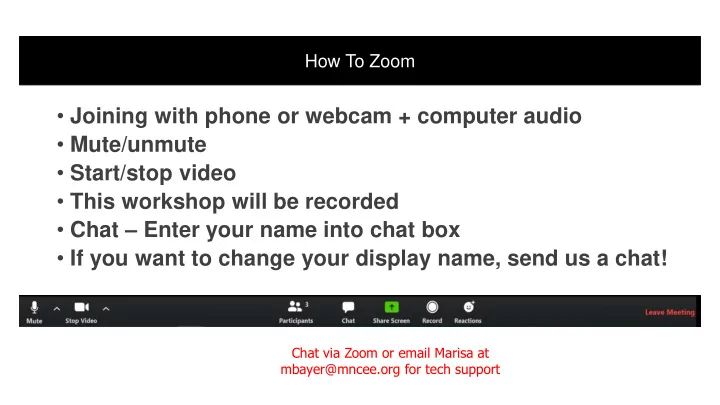
Mute/unmute Start/stop video This workshop will be recorded Chat - - PowerPoint PPT Presentation

mute unmute
SMART_READER_LITE
LIVE PREVIEW

Mute/unmute Start/stop video This workshop will be recorded Chat - - PowerPoint PPT Presentation

How To Zoom Joining with phone or webcam + computer audio Mute/unmute Start/stop video This workshop will be recorded Chat Enter your name into chat box If you want to change your display name, send us a chat! Chat via


slide-1
SLIDE 1
  • Joining with phone or webcam + computer audio
  • Mute/unmute
  • Start/stop video
  • This workshop will be recorded
  • Chat – Enter your name into chat box
  • If you want to change your display name, send us a chat!

Chat via Zoom or email Marisa at mbayer@mncee.org for tech support

How To Zoom

slide-2
SLIDE 2

Inver Grove Heights Planning Workshop 1

Wednesday, July 22 Zoom Meeting

slide-3
SLIDE 3

Agenda & Objectives

BLOCK 1 Orientation BLOCK 2 Baselining Break BLOCK 3 Visioning BLOCK 4 Wrap Up & Next Steps

slide-4
SLIDE 4
  • Use the “Chat” feature

– Fastest way to get a response! – Facilitators will record questions & responses

  • On a “Questions” slide, unmute yourself to ask
  • Please be respectful

Questions & Comments

Chat via Zoom or text Jamie at 609-439-8852 for tech support

slide-5
SLIDE 5

City of Inver Grove Heights

Welcome from Heather Rand

5

slide-6
SLIDE 6
  • Name
  • Affiliations
  • What’s your favorite place in

Inver Grove Heights? Drop a

Who’s on the call?

6

slide-7
SLIDE 7

7

Community Affiliations & Connections

3 5 4 3 3 1 1 2 3

10 20 30 40 50 Business associations (e.g. Chamber

  • f Commerce)

City Council or Committee City departments CongregationsSchool district Higher education Nonprofit or service providers (e.g. food pantry) Civic clubs or community groups (e.g. Lions Club) Other - Write In (Required) Number of Participants

From Survey

slide-8
SLIDE 8

Partners in Energy Program Manager

Welcome from Tami Gunderzik

8

slide-9
SLIDE 9

Community Facilitators (CEE)

Marisa Bayer Jamie Johnson

9

Partners in Energy Team

Xcel Energy

Tami

Gunderzik

Yvonne Pfeifer

Jake Sedlacek Ashley Haung

slide-10
SLIDE 10
  • Partners in Energy is a two-year collaboration with Xcel Energy to

develop and implement your individual community energy plan goals.

  • Opportunity to engage stakeholders, create goals and strategies,

and develop a work plan to be successful.

10

What is Partners in Energy?

Developing the Plan (4-6 months) Implementation with Partners in Energy (18-20 months) Continued Implementation

slide-11
SLIDE 11
  • Develop a better understanding of the energy needs of

communities we serve

  • Better align the services and programs we offer with customer

needs to save energy and advance clean energy goals

  • Strengthen relationships with the community and support the

Xcel Energy philosophy of community engagement

11

Xcel Energy’s Goals

slide-12
SLIDE 12

12

Xcel Energy’s Carbon-free Future

slide-13
SLIDE 13

13

slide-14
SLIDE 14

14

slide-15
SLIDE 15

15

Plan Development Steps

  • 1. Anchoring
  • 2. Baseline
  • 3. Vision
  • 4. Focus

Areas

  • 5. Draft Goals
  • 6. Divergent

Strategies 7. Convergent Strategies

  • 8. Goal

Refinement

  • 9. Action

Planning

  • 10. Plan

Finalization

  • 11. Launch
slide-16
SLIDE 16

How are we going to meet

  • ur targets?

What needs to be done in this area to meet the goal? How will we focus our efforts to achieve our goal? How do we know if we are successful? What should Inver Grove Heights’ energy future look like? Vision Goal Focus Area 1 Targets Strategies Focus Area 2 Targets Strategies Focus Area 3 Targets Strategies

16

Plan Framework

slide-17
SLIDE 17

17

Plan Framework

slide-18
SLIDE 18

Where are we starting from?

Baselining

18

slide-19
SLIDE 19

How are we going to meet

  • ur targets?

What needs to be done in this area to meet the goal? How will we focus our efforts to achieve our goal? How do we know if we are successful? What should Inver Grove Heights’ energy future look like? Vision Goal Focus Area 1 Targets Strategies Focus Area 2 Targets Strategies Focus Area 3 Targets Strategies

19

Plan Framework

slide-20
SLIDE 20
  • Step 4 in GreenStep Cities (June

2020)

  • Transition to Sustainable Operations

(TSO)

  • Energy Efficiency in City Facilities

– Energy Benchmarking – Recommissioning community facilities

  • Participated in Cities Charging

Ahead (2019)

20

Inver Grove Heights Sustainability Initiatives

Image by Inver Grove Heights

slide-21
SLIDE 21
  • Renewable Energy for City Facilities

(~40%)

– Geothermal energy in City Hall (2012) – Community Solar Subscriptions (2016) – Rooftop solar at City Hall & VMCC (2017)

  • Multifamily Recycling
  • Recycling in City Facility and Events

21

Inver Grove Heights Sustainability Initiatives

Image by Inver Grove Heights

slide-22
SLIDE 22

Look into Inver Grove Heights community demographics and how your community uses and saves energy Please feel free to follow along with the Data Summary Sheet

Data Overview

Image by Arkyan | CC BY-SA 4.0.

slide-23
SLIDE 23
  • Mid-sized City

– 35,300 residents with 14,200 households

23

Inver Grove Heights Demographics

“Minutes away from MSP International Airport, two major urban centers”

“Inver Grove Heights supports a

development pattern that accommodates urban, suburban, and rural Lifestyles.”

  • Inver Grove Height’s 2040 Comprehensive Plan

Images from Inver Grove Heights’ Comprehensive Plan

slide-24
SLIDE 24
  • A Diverse Community

– A diversity of races, ages, ethnicities, and family structures

24

Inver Grove Heights Demographics

  • 76% of residents are white
  • 11% are Hispanic or Latinx
  • 15% speak a language other

than English

  • 30% families with children
  • 16% of the population is over

the age of 65

Image by City of Inver Grove Heights.

slide-25
SLIDE 25
  • Somewhat affluent

– Median income slightly above state- wide average, but some households living below poverty level

25

Inver Grove Heights Demographics

  • $74,900 median income

Compared to $68,400 for MN & $76,900 for metro region

  • 8.4% of residents live below

the poverty level

Compared to 9.6% for MN & 9.4% for the metro region

– 20% are below 185% of the poverty level

From Metropolitan Council Community Profile Data https://stats.metc.state.mn.us/profile/ & The American Community Survey, 2018 Estimates

This Photo by Unknown Author is licensed under CC BY-NC

slide-26
SLIDE 26
  • Average energy burden is

2%

  • 28% of households

experience housing cost burden

– 43% of renters experiencing housing cost burden

26

Energy & Housing Cost Burden

From Metropolitan Council Community Profile Data https://stats.metc.state.mn.us/profile/ & The American Community Survey, 2018 Estimates & Dept. Of Energy’s Office of Energy Efficiency and Renewable Energy’s Low-Income Energy Affordability Tool

slide-27
SLIDE 27
  • Mixed housing

– Half of homes are single-family detached, 35% are rented

27

Inver Grove Heights Community Data

27

Single Family, Detached 50% Multifamily (5 units or more) 23% Townhome (single family, attached) 19% Duplex, Triple, and Quad 2% Manufactured Home 6%

Housing Type, 2018 (Estimates)

14,618 Total Housing Units

From Metropolitan Council Community Profile Data https://stats.metc.state.mn.us/profile/ Image by Partners in Energy

slide-28
SLIDE 28
  • A strong business community

with prominent institutions

– A mix of large and small businesses across the city – Heavy education presence through schools and college

28

Inver Grove Heights Community Data

  • 10,621 people employed in

the city

  • Top Industries (2019)

– Retail Trade – Health Care and Social Assistance – Educational Services – Manufacturing – Accommodation & Food Services

From Metropolitan Council Community Profile Data https://stats.metc.state.mn.us/profile/ & DEED Quarterly Census of Employment and Wages (QCEW)

This Photo by Unknown Author is licensed under CC BY-SA

slide-29
SLIDE 29
  • Car-dependent

– Almost every household owns

  • ne or more cars

29

Inver Grove Heights Community Data

  • 83% of residents drive

alone to work

– Average travel time: 23 minutes

  • 98% of households have at

least 1 vehicle available – 82% have 2 or more vehicles

From Metropolitan Council Community Profile Data https://stats.metc.state.mn.us/profile/ & The American Community Survey, 2018 Estimates Image from Pexels | CC0

slide-30
SLIDE 30
  • Mixed housing

– Half of homes are single-family detached, 35% are rented

  • A strong business

community with prominent institutions

– A mix of large and small businesses across the city

  • Car-dependent

– Almost every household owns one

  • r more cars

30

Inver Grove Heights Key Takeaways

From Metropolitan Council Community Profile Data https://stats.metc.state.mn.us/profile/ & The American Community Survey, 2018 Estimates

  • Mid-sized City

– 35,300 residents with 14,200 households

  • A Diverse Community

– A diversity of races, ages, ethnicities, and family structures

  • Somewhat affluent

– Median income slightly above state-wide average, but some households living below poverty level

slide-31
SLIDE 31
  • What surprised you?
  • Is there a data point we missed?
  • Are there data we should bring to

the next workshop (focus areas)?

Inver Grove Heights Demographics & Community Background

slide-32
SLIDE 32

Break Returning at 4:20pm

slide-33
SLIDE 33
  • Both Xcel Energy and Dakota Electric data included unless
  • therwise noted
  • 15 x15 Data Privacy Rule

– Must be greater than 15 entities – No single entity can account for more than 15% of the usage – One commercial premise was removed from the data

  • Data is pulled for 2017-2019 to provide baseline to measure goals
  • Both consumption and savings data provided
  • Data are unofficial for planning purposes and results may change

slightly

33

Energy Data 101

slide-34
SLIDE 34
  • Premise: Unique identifier for location of service; premise ≠ customer
  • Residential: represents residential premises, including single-family

and townhomes

  • Commercial & Industrial: represents business customers, such as

restaurants, gas stations, office buildings, and hotels

  • Municipal: refers to the City of Inver Grove Heights only
  • Multi-family properties are metered differently and varies

– Electricity is usually residential sector – Natural gas is usually commercial & industrial sector

34

Energy Data 101

slide-35
SLIDE 35

1. Determining where to focus your efforts 2. Making data-informed decisions about target actions and activities 3. Determining baselines from which to measure goals

35

How will we be using this data?

slide-36
SLIDE 36

Most customers are residential

36

Most Customers Served by Xcel Energy

Data note: Xcel Energy electric premises only

Dakota Electric 10% Xcel Energy 90%

Electric Premises (2019) 17,621 Total Premises

slide-37
SLIDE 37

Most electric customers are residential in Inver Grove Heights

Reminder: Municipal is only City of Inver Grove Heights

37

Data note: Xcel Energy & Dakota Electric

Residential 91% Commerical and Industrial 8% Municipal 1%

Majority of Customers are Residential

slide-38
SLIDE 38

38

Residents and Business Use Similar Amounts of Energy

Municipal 1%

17,943,292 therms

Municipal 3%

Electricity Use by Sector (2019) 221 million kWh

Residential 50% Commercial and Industrial 47% Residential 61% Commercial and Industrial 38%

Data note: Xcel Energy & Dakota Electric

slide-39
SLIDE 39

39

Energy Costs (2019)

$36 million

$- $5 $10 $15 $20 $25 $30 $35 $40 2019 $ Million Municipal Commercial and Industrial Residential

Sector Total Costs Costs per premise Municipal (City) $655,000 $10,400 Commercial & Industrial $13.9 million $9,600 Residential $21.0 million $1,300

Data note: Xcel Energy & Dakota Electric

slide-40
SLIDE 40

40 110 117 111 111 112 105 6 6 6 226 234 222 100 200 300 400 500 600 700 800 900 1,000 1,100 1,200

  • 50

100 150 200 250 2017 2018 2019 Cooling Degree Days (CDD) Million kWh

Electricity Consumption

Residential Commercial and Industrial Municipal CDD Data note: Xcel Energy (electric + gas) & Dakota Electric (electric only)

Energy Use Trends

9 11 11 6 7 7

  • 15

18 18

1,000 2,000 3,000 4,000 5,000 6,000 7,000 8,000 9,000

  • 2

4 6 8 10 12 14 16 18 20 2017 2018 2019

Heating Degree Days (HDD) therms

Millions

Natural Gas Consumption

Residential Streetlights Municipal HDD

slide-41
SLIDE 41

41

88 99 97 72 77 72 2 3 2 162 178 172

1,000 2,000 3,000 4,000 5,000 6,000 7,000 8,000 9,000 10,000

  • 20

40 60 80 100 120 140 160 180 200 2017 2018 2019 Total Degree Days Thousand Metric Tons CO2e

Greenhouse Gas Emissions

Residential Commercial and Industrial Municipal TDD

slide-42
SLIDE 42

Residential Avg. Participation

  • Avg. Savings

(kWh)

  • Avg. Savings

(therms) Equipment Rebate 557 240,481 36,302 Rate Savings 283 1,726 854 New Construction 86 93,837 22,739 Audit 77 33,591 1,658 Low-income 40 15,592 4,879 Dakota Electric Programs 61 45,347 N/A Commercial/Industrial Equipment Rebate 90 2,182,598 29,570 Audit 3 87,624

  • New Construction

2 37,875 42,217 Rate Savings 2

  • Dakota Electric Programs

3 58,189 N/A

42

Energy Conservation Program Participation

Programs categorized into classifications by facilitators. For a list of popular programs, see handouts. EV Programs and residential LED programs are not included in the above data.

slide-43
SLIDE 43

Residential Metric Tons CO2e Emissions avoided

1,492

Equal to…. Removing 322 cars from the road for a year

  • r

1/3 the annual output of a wind turbine Commercial & Industrial Emissions avoided

3,670

Equal to…. Removing 790 cars from the road for a year

  • r

80% of the annual output of a wind turbine

43

Greenhouse Gas Emissions Avoided (2017-2019)

Data note: Xcel Energy programs only

slide-44
SLIDE 44

Renewable Energy Subscriptions Rooftop Solar Community Solar Gardens

44

Residential Renewable Energy (2019)

Renewable Energy Subscriptions Rooftop Solar Community Solar Gardens

  • 586 subscribers
  • 1.5 million kWh
  • 24 installations
  • 84,000 kWh
  • 288 subscribers
  • 1.3 million kWh

Xcel Energy’s Windsource & Renewable*Connect Xcel Energy’s Solar*Rewards & Dakota Electric Rooftop Solar Third party Solar Garden Companies

slide-45
SLIDE 45

Renewable Energy Subscriptions Rooftop Solar Community Solar Gardens

45

Business Renewable Energy (2019)

Renewable Energy Subscriptions Rooftop Solar Community Solar Gardens

  • 1 subscriber
  • 600,000 kWh
  • 2 installations
  • 8.7 million kWh
  • 46 subscribers
  • 3.7 million kWh

Xcel Energy’s Windsource & Renewable*Connect Xcel Energy’s Solar*Rewards only Third party Solar Garden Companies

slide-46
SLIDE 46

Renewable Energy Subscriptions Rooftop Solar

46

Dakota Electric Renewable Energy (2019)

Renewable Energy Subscriptions Rooftop Solar

  • 27 subscribers
  • 173,000 kWh
  • 3 installations

Dakota Electric Wellspring Dakota Electric Rooftop Solar

slide-47
SLIDE 47
  • Total energy use & emissions have increased slightly over the 3

year baseline

– Correlates with heating/cooling degree day changes

  • Even though Commercial & Industrial sector represent only 8% of

premises, they consume around half of energy used

  • Residents spend over $1,300 on energy/year
  • Inver Grove Heights has, through utility energy programs, saved the

equivalent of taking over 1,000 cars off the road for a year.

47

Key Data Highlights

slide-48
SLIDE 48
  • What surprised you?
  • Do you have lingering questions?

48

Data Questions

slide-49
SLIDE 49

What is Inver Grove Heights’ energy future?

Visioning

49

slide-50
SLIDE 50

How are we going to meet

  • ur targets?

What needs to be done in this area to meet the goal? How will we focus our efforts to achieve our goal? How do we know if we are successful? What should Inver Grove Heights’ energy future look like? Vision Goal Focus Area 1 Targets Strategies Focus Area 2 Targets Strategies Focus Area 3 Targets Strategies

50

Plan Framework

slide-51
SLIDE 51

51

Why is it important to create an Energy Action Plan?

Envision a better future

“Provide a vision…” “…think of energy use comprehensively…”

Educate and Improve Awareness

“Bring awareness to opportunities to reduce costs of energy and benefit the environment.” “…encourage residents and businesses to embrace energy changes that will ultimately reduce climate change.”

Combat Climate Change

“…help create a more sustainable growth” “…take action to reduce energy consumption and shift towards renewable options…” “embrace energy changes that will ultimately reduce climate change.”

Come together as a community

“…shows that we, as a community, are in control of the condition of our environment and can make a difference.” “…engage the community in this effort…”

slide-52
SLIDE 52

We will empower all Inver Grove Heights community members, including residents and businesses, to take action to conserve energy and reduce energy costs through supporting energy efficiency, renewable energy, and efficient transportation. This work will use Inver Grove Heights-specific data and find innovative and unique ways to promote community-wide environmental, social, and economic sustainability by engaging all community members, and will demonstrate community pride in our natural and built environment.

Your Vision

slide-53
SLIDE 53

Wrap Up

53

slide-54
SLIDE 54

Gained an understanding of the Inver Grove Heights community through data Learned about how Inver Grove Heights uses and saves energy Reviewed Inver Grove Heights’ energy vision

54

What we accomplished today

Were introduced to the Partners in Energy Planning Process

slide-55
SLIDE 55

Deciding where to focus the efforts of the plan Exploring goal metrics and messaging Brainstorming pathways to meet the vision of the plan Follow-up from this workshop → Notes, scheduling next workshops, & a survey

55

What’s next?

slide-56
SLIDE 56

56