
Multivariate Volume Visualization through Dynamic Projections
Shusen Liu∗
SCI Institute, University of Utah
Bei Wang†
SCI Institute, University of Utah
Jayaraman J. Thiagarajan ‡
Lawrence Livermore National Laboratory
Peer-Timo Bremer §
Lawrence Livermore National Laboratory
Valerio Pascucci ¶
SCI Institute, University of Utah
(a) (b) (f) (g) (h) (i) (c) (d) (e) (a) (c) (d) (e) (j) (k) temperature pressure Subspace View Navigation Panel
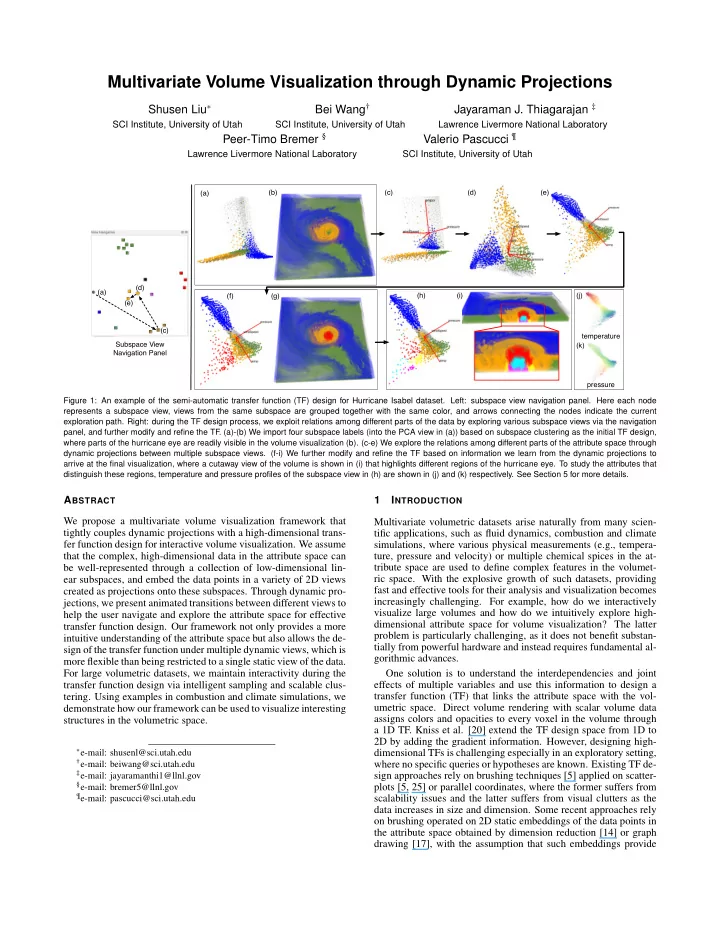
Figure 1: An example of the semi-automatic transfer function (TF) design for Hurricane Isabel dataset. Left: subspace view navigation panel. Here each node represents a subspace view, views from the same subspace are grouped together with the same color, and arrows connecting the nodes indicate the current exploration path. Right: during the TF design process, we exploit relations among different parts of the data by exploring various subspace views via the navigation panel, and further modify and refine the TF . (a)-(b) We import four subspace labels (into the PCA view in (a)) based on subspace clustering as the initial TF design, where parts of the hurricane eye are readily visible in the volume visualization (b). (c-e) We explore the relations among different parts of the attribute space through dynamic projections between multiple subspace views. (f-i) We further modify and refine the TF based on information we learn from the dynamic projections to arrive at the final visualization, where a cutaway view of the volume is shown in (i) that highlights different regions of the hurricane eye. To study the attributes that distinguish these regions, temperature and pressure profiles of the subspace view in (h) are shown in (j) and (k) respectively. See Section 5 for more details.
ABSTRACT We propose a multivariate volume visualization framework that tightly couples dynamic projections with a high-dimensional trans- fer function design for interactive volume visualization. We assume that the complex, high-dimensional data in the attribute space can be well-represented through a collection of low-dimensional lin- ear subspaces, and embed the data points in a variety of 2D views created as projections onto these subspaces. Through dynamic pro- jections, we present animated transitions between different views to help the user navigate and explore the attribute space for effective transfer function design. Our framework not only provides a more intuitive understanding of the attribute space but also allows the de- sign of the transfer function under multiple dynamic views, which is more flexible than being restricted to a single static view of the data. For large volumetric datasets, we maintain interactivity during the transfer function design via intelligent sampling and scalable clus-
- tering. Using examples in combustion and climate simulations, we
demonstrate how our framework can be used to visualize interesting structures in the volumetric space.
∗e-mail: shusenl@sci.utah.edu †e-mail: beiwang@sci.utah.edu ‡e-mail: jayaramanthi1@llnl.gov §e-mail: bremer5@llnl.gov ¶e-mail: pascucci@sci.utah.edu
1 INTRODUCTION Multivariate volumetric datasets arise naturally from many scien- tific applications, such as fluid dynamics, combustion and climate simulations, where various physical measurements (e.g., tempera- ture, pressure and velocity) or multiple chemical spices in the at- tribute space are used to define complex features in the volumet- ric space. With the explosive growth of such datasets, providing fast and effective tools for their analysis and visualization becomes increasingly challenging. For example, how do we interactively visualize large volumes and how do we intuitively explore high- dimensional attribute space for volume visualization? The latter problem is particularly challenging, as it does not benefit substan- tially from powerful hardware and instead requires fundamental al- gorithmic advances. One solution is to understand the interdependencies and joint effects of multiple variables and use this information to design a transfer function (TF) that links the attribute space with the vol- umetric space. Direct volume rendering with scalar volume data assigns colors and opacities to every voxel in the volume through a 1D TF. Kniss et al. [20] extend the TF design space from 1D to 2D by adding the gradient information. However, designing high- dimensional TFs is challenging especially in an exploratory setting, where no specific queries or hypotheses are known. Existing TF de- sign approaches rely on brushing techniques [5] applied on scatter- plots [5, 25] or parallel coordinates, where the former suffers from scalability issues and the latter suffers from visual clutters as the data increases in size and dimension. Some recent approaches rely
- n brushing operated on 2D static embeddings of the data points in