
3/18/2012 1
2012 HAMPTON ROADS REAL ESTATE MARKET REVIEW
MULTI-FAMILY
PRESENTED BY: DWIGHT D. DUNTON III PRESIDENT 2012 Multi‐Family Presentation
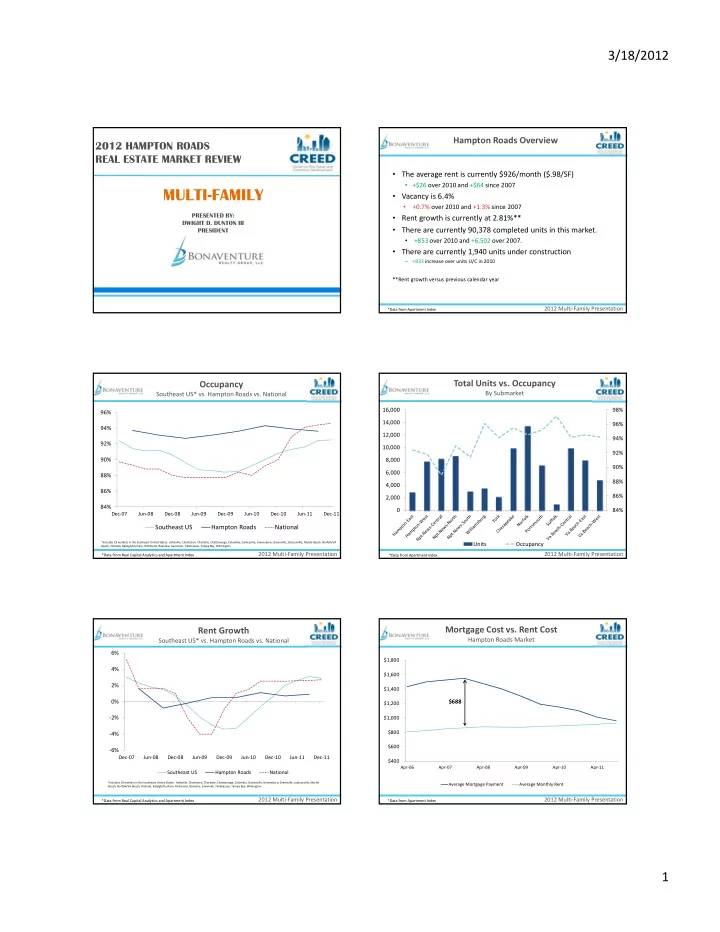
Hampton Roads Overview
- The average rent is currently $926/month ($.98/SF)
- +$26 over 2010 and +$64 since 2007
- Vacancy is 6.4%
- +0.7% over 2010 and +1.3% since 2007
- Rent growth is currently at 2.81%**
- There are currently 90,378 completed units in this market.
- +853 over 2010 and +6,502 over 2007.
- There are currently 1,940 units under construction
– +833 increase over units U/C in 2010 **Rent growth versus previous calendar year
*Data from Apartment Index
2012 Multi‐Family Presentation 84% 86% 88% 90% 92% 94% 96%
Dec‐07 Jun‐08 Dec‐08 Jun‐09 Dec‐09 Jun‐10 Dec‐10 Jun‐11 Dec‐11
Occupancy
Southeast US* vs. Hampton Roads vs. National Southeast US Hampton Roads National
*Includes 19 markets in the Southeast United States: Asheville, Charleston, Charlotte, Chattanooga, Columbia, Gainesville, Greensboro, Greenville, Jacksonville, Myrtle Beach, Norfolk/VA Beach, Orlando, Raleigh/Durham, Richmond, Roanoke, Savannah, Tallahassee, Tampa Bay, Wilmington
*Data from Real Capital Analytics and Apartment Index
2012 Multi‐Family Presentation 84% 86% 88% 90% 92% 94% 96% 98% 2,000 4,000 6,000 8,000 10,000 12,000 14,000 16,000
Total Units vs. Occupancy
By Submarket
Units Occupancy
*Data from Apartment Index
2012 Multi‐Family Presentation ‐6% ‐4% ‐2% 0% 2% 4% 6%
Dec‐07 Jun‐08 Dec‐08 Jun‐09 Dec‐09 Jun‐10 Dec‐10 Jun‐11 Dec‐11
Rent Growth
Southeast US* vs. Hampton Roads vs. National
Southeast US Hampton Roads National
*Includes 19 markets in the Southeast United States: Asheville, Charleston, Charlotte, Chattanooga, Columbia, Gainesville, Greensboro, Greenville, Jacksonville, Myrtle Beach, Norfolk/VA Beach, Orlando, Raleigh/Durham, Richmond, Roanoke, Savannah, Tallahassee, Tampa Bay, Wilmington
*Data from Real Capital Analytics and Apartment Index
2012 Multi‐Family Presentation
$400 $600 $800 $1,000 $1,200 $1,400 $1,600 $1,800
Apr‐06 Apr‐07 Apr‐08 Apr‐09 Apr‐10 Apr‐11
Mortgage Cost vs. Rent Cost
Hampton Roads Market
Average Mortgage Payment Average Monthly Rent
*Data from Apartment Index
$688